1 Introduction
The overall goal of this section is to provide a primer on microplastics (MP) and introduce the various sections of the guidance. Click on any red dot in Figure 1-1 to read about MPs in the environment.

Microplastics can be transported through atmospheric deposition
Discarded fishing line and nets and degradation of paint from vessels contribute to microplastic formation
Macroplastic trash may wash into the ocean, then break up into smaller and smaller pieces, which become microplastics
Industrial air emissions may contain microplastics
Manufacturing of primary microplastics such as nurdles to produce macroplastics can result in the release of microplastics to the environment
Microplastics can be released through wastewater outfalls and be transported by water
Microplastics can be released through wastewater outfalls and be transported by water
Aquatic organisms ingest microplastics, which can result in trophic transfer
Microplastics are generated through typical tire wear and breakdown of roadway materials
Microplastics may be present in agricultural lands due to direct application of fertilizer pellets, biosolids from wastewater treatment plants, or breakdown of plastic sheeting
Microplastics are generated by the breakdown of singe use plastics
Microplastics can be generated through the breakdown of rubberized play surfaces and plastic playground equipment or rubber mulch
Microplastics may be present in household products such as toothpaste or facial cleaners. Microplastics can be generated through household activities such as laundering of clothing
Microplastics have been found in snow on high mountain peaks
Microplastics are found in groundwater
Landfilling of macroplastics can lead to generation of microplastics
Microplastics are found in stormwater runoff
Figure 1-1. Microplastics in the environment.
Source: Jonathan McDonald
1.1 What Are Microplastics?
Various organizations, agencies, and researchers have defined MP in different ways. For the purposes of this document, MP are particles that are greater than 1 nanometer (nm) and less than 5,000,000 nm (or 5 millimeters [mm]) in their longest dimension and consist of solid polymeric materials to which chemical additives or other substances may have been added (CA SWRCB 2020). Polymers that are derived in nature (for example, cellulose, amber, proteins, wool, or silk) that have not been chemically modified (other than by hydrolysis) are excluded from the scope of this document. Plastic particles less than 1,000 nm in their longest dimension are also referred to as nanoplastics (NP); as such, some, but not all, NP fall within the range of MP defined herein. Although the definition of NP is still being debated, it is accepted in scientific literature that they are produced by the fragmentation of MP (or larger particles), measure between 1 nm and 1,000 nm in length, and demonstrate a colloidal behavior. Figure 1-2 shows the sizes of various items that fall within the MP size range, including a strand of DNA (approximately 2.5 nm), a red blood cell (7,500–10,000 nm), a fly ash particle (10,000–20,000 nm), the diameter of a human hair (60,000–120,000 nm), and a drinking straw (approximately 5,000,000 nm). This guidance document is not intended to specifically address NP that fall outside the range of MP but does provide limited further discussion of NP.
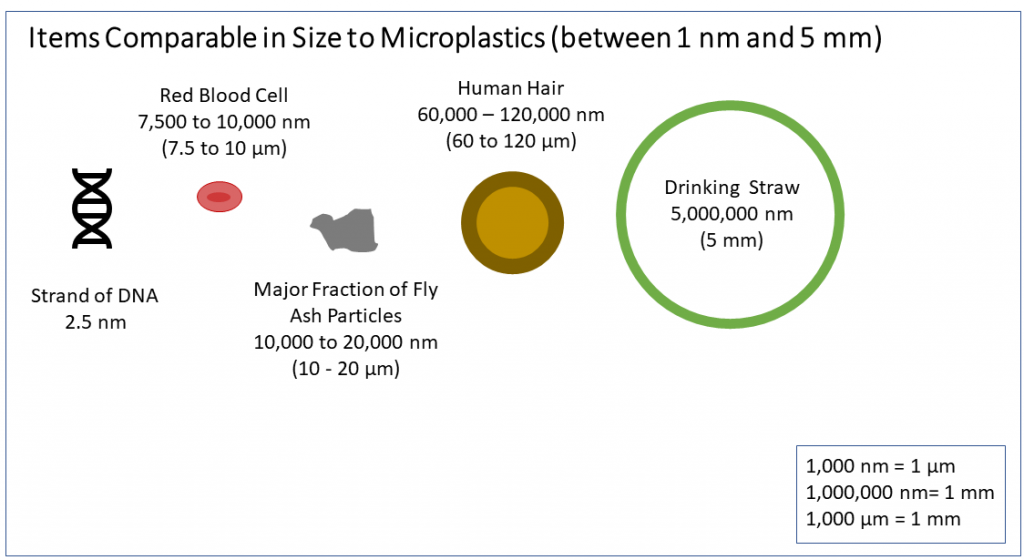 Figure 1-2. Items comparable in size to microplastics.
Source: Valerie Hanley
Although MP may be present in some consumer products, the bulk of MP in the environment likely result from the degradation of macroplastics. Primary sources of MP are materials that are manufactured using micro-sized plastic particles. Examples of primary sources or products containing MP include toothpaste or facial cleansers where microbeads are used as abrasives, makeup containing glitter, and as coatings on seeds, fertilizers, or pesticides. Secondary MP result from the breakdown of larger (macroplastic) particles or plastic products; their composition will be tied to the parent product or material.
Plastics are used in the manufacture of everyday products such as plastic bags, packaging, bottles, toys, food containers, cigarette filters, fishing line, rubber mulch, surface coatings, and other products. These materials when left outside or disposed in landfills may break down through chemical and physical processes, resulting in the formation of MP. As such, the visible plastic litter frequently observed along roadsides, in ditches, on beaches, or floating in water bodies, left untended, may eventually break down, resulting in the formation of MP, which are more readily transported through the environment than larger particles. Anthropogenic processes or actions may also contribute to the formation of MP in the environment. Two examples of such processes are the creation of MP from the wear of tires and the creation of MP during washing of clothing and textiles containing plastics.
1.2 History of Plastics
Human use of polymers dates to at least 1600 BC, but commercial production of plastics started in the 1920s and 1930s with widespread use outside of the military after World War II (Geyer, Jambeck, and Lavender Law 2017). Annual worldwide production of plastics increased exponentially from 1.5 million metric tons (MMT) in 1950 to 368 MMT in 2019 (NASEM 2022), with over 10,000 MMT of plastics produced worldwide since 1950. It is estimated that approximately 30 percent of all plastics ever produced are still in use today, while 60 percent have been disposed of in landfills or entered the environment, and the remaining 10 percent were incinerated or recycled (Geyer, Jambeck, and Lavender Law 2017).
The observation of small pieces of plastic debris in surface water, in the stomachs of birds, and in fish was first described in scientific papers published in the 1960s and 1970s (Carpenter et al. 1972, Colton, Burns, and Knapp 1974). However, the term “MP” was introduced only in 2004 (Thompson et al. 2004), and the issue of MP garnered widespread attention only in the 2010s as the result of ongoing scientific research and increasing attention to the impact of plastics on the environment. Monitoring of plastic debris in various parts of the world began in the 1990s; however, little long-term monitoring data exist specifically for MP to assist in assessing temporal changes. Okoffo et al. (2021) presented plastic prevalence data from archived biosolids collected from 1950 to 2016, providing one method that could be applied elsewhere to improve data on changes in plastic prevalence over time using archived samples. One potential problem with long-term comparisons across multiple data sets is the lack of standard methods for collecting and processing samples (see Section 3 for detailed information on sampling).
1.3 The Making of Plastics
1.3.1 Natural Plastics
Although many people associate the term “plastics” with synthetic plastics, plastics also occur naturally in the environment. “Plastic” is a broad term for materials that can be molded or shaped, and then hardened, maintaining their shape. Natural plastics, such as amber, animal horn, tar, latex, shellac, and cellulose, occur in a variety of different shapes, sizes, and colors (Science History Institute 2022). Cellulose, generally considered a natural plastic, can also be chemically modified to form semisynthetic materials such as rayon (Mendes, Prates, and Evtuguin 2021) or cellulose acetate.
1.3.2 Synthetic Plastics
Synthetic plastics are made from two main sources: fossil fuels and organic materials (Table 1-1). The majority of plastics are synthesized from petroleum products. Two common methods for synthesis of plastics from petroleum are addition polymerization and condensation polymerization. Addition polymerization consists of linking together monomers possessing double or triple bonds to form polymers. Condensation polymerization creates plastics via repeated condensation reactions between two different monomers (Science History Institute 2022).
Table 1-1. Common plastic polymers and their abbreviations
| Resin Code | Plastic Type Abbreviation | Plastic Type Name | Product Examples |
| PET | Polyethylene terephthalate | Water and soft drink bottles, salad dressing/peanut butter containers, rope, carpet, polyester fibers | |
| HDPE | High-density polyethylene | Milk jugs, juice bottles, freezer bags, trash bags, shampoo/detergent bottles | |
| PVC | Polyvinyl chloride | Plumbing and construction materials, pipes, liners, cosmetic containers, commercial cling wrap, siding | |
| LDPE | Low-density polyethylene | Squeeze bottles, regular cling wrap, trash bags, shopping bags, furniture | |
| PP | Polypropylene | Microwave dishes, medicine bottles, straws, ice cream tubs, yogurt containers, detergent bottle caps | |
| PS/EPS | Polystyrene/Expanded polystyrene | PS—CD cases, disposable cups, egg cartons, cutlery, video casesEPS—Foam polystyrene, hot drink cups, food takeaway trays, protective packaging pellets |
|
| Other |
POM | Acetal (polyoxymethylene) | Fan wheels, gears, screws |
| PMMA | Acrylic (polymethyl methacrylate) | Aquariums, fiber optics, paint | |
| ABS | Acrylonitrile butadiene styrene | Car parts, Lego, wheel covers | |
| PA | Nylon (polyamide) | Air bags, clothing, thread | |
| P | Polyester | Fibers, rope | |
| PBT | Polybutylene terephthalate | Keyboards, relays, switches | |
| PC | Polycarbonate | Eyewear, safety helmets | |
| PEEK | Polyetheretherketone | Bearings, pump, pistons | |
| PE | Polyethylene | Mulch, housewares, toys | |
| PLA | Polylactic acid (bioplastic) | Packaging, syringes, textiles | |
| PSU | Polysulfone | Appliance parts, filters | |
| PTFE | Polytetrafluoroethylene | Teflon | |
| PUR, PU | Polyurethane | Adhesives, coatings, foams | |
| SAN | Styrene acrylonitrile | Brushes, hangers, printers |
When plastics are synthesized from organic materials, such as plants, they are called bioplastics (Science History Institute 2022). Bioplastics are currently less prevalent than traditional synthetic plastics. Bioplastics, by definition, are biobased, biodegradable, or both (Di Bartolo, Infurna, and Dintcheva 2021). Plastics that are biobased are derived in part or in whole from organic biological material (corn starch, cellulose, etc.). Some fibers, such as rayon, which has a cellulose base material that is dissolved from the original plant material and reprocessed into fibers, are considered semisynthetic plastics (Mendes, Prates, and Evtuguin 2021).
Many plastics start as a molecule of hydrocarbon and are then formed into chains using either addition or condensation polymerization (Science History Institute 2022). Plastics formed using addition polymerization typically can be softened by heating and hardened by cooling and are called thermoplastics. Plastics formed using condensation polymerization can be either a thermoplastic polymer or a thermoset polymer. Thermoset plastics retain their shape after forming, and after hardening, they cannot be remelted.
It is the linking of those molecules into polymers that gives each plastic type its unique properties. Polymers can form straight, branched, or crosslinked chains, depending on the type of chemical bonds that occur. Polymers can also have no defined molecular structure, called amorphous polymers, which are generally transparent and have a lower melting point. Polymers that are highly structured, called crystalline, are generally translucent and have a higher melting point (Science History Institute 2022).
Plastics that are biodegradable are capable of breaking down into natural materials (that is, carbon dioxide, water, organic matter), but are not necessarily biobased. Biodegradation of bioplastics requires that certain conditions be met (for example, temperature, humidity, presence of microorganisms), which is often only achieved by industrial composting plants. Access to composting facilities that are able to accept plastics is limited and varies by state (Figure 1-3). In the absence of those conditions, bioplastics can have the same environmental impacts as synthetic plastics, including the generation of MPs (Wang, Yu, et al. 2021).
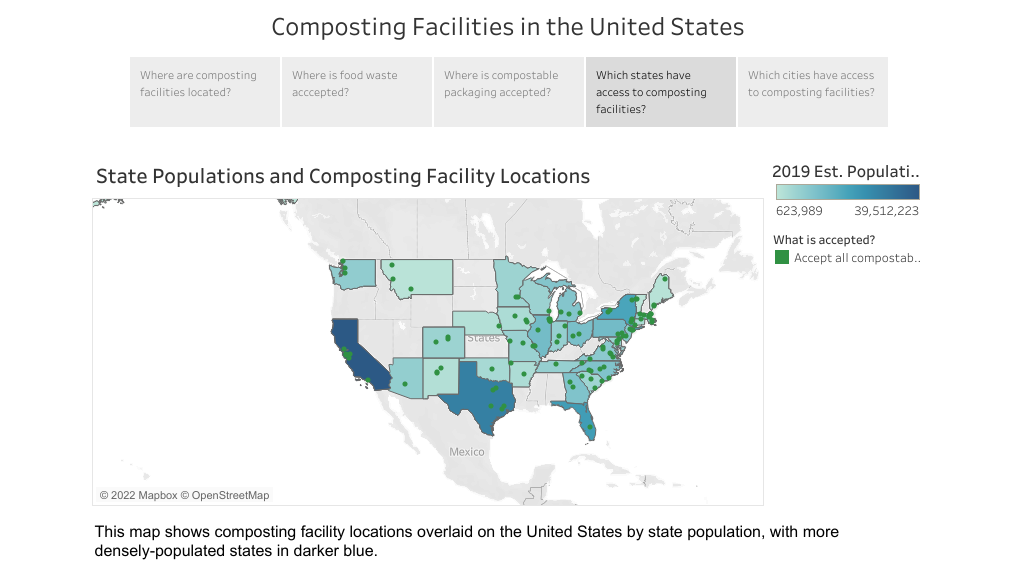 Figure 1-3. Map showing composting facility locations and state populations, with more densely populated states presented in darker blue.
Source: Greenblue.org
1.3.3 Physical and Chemical Properties of Microplastics
The diverse physical and chemical properties of MP impact their transportation, distribution, and degradation (Section 2), and their potential adverse health effects on human health and the environment (Section 4). Relevant physical properties include size and volume, shape, surface area, density, hydrophobicity, and crystallinity. Chemical properties include the polymer type, additives, surface charge, and sorbed substances.
Typical shape categories for MP include fibers (lines, filaments, and threads), films, foam, beads or spheres, pellets, and fragments (including powders and flakes) (Figure 1-4). The shape and structure of secondary MP are influenced by weathering and degradation—photo-oxidative, mechanical, and biological (Gray and Weinstein 2017)—and the amount of time the MP has been in the environment. The shape and structure of secondary MP may be indicative of the potential sources of the MP observed. For example, fibers tend to originate from clothing, textiles, or carpet; spheres may be microbeads from personal care products; pellets most commonly originate from raw materials used for plastic product manufacturing; and foam is often from expanded polystyrene (EPS) foam insulation or food packaging (Rochman et al. 2019). Plastic films are often reported on beaches and at the surface and bottom of water bodies; however, films are almost never reported among MP data, likely due to their breakup into threads and filaments (Chubarenko et al. 2016).
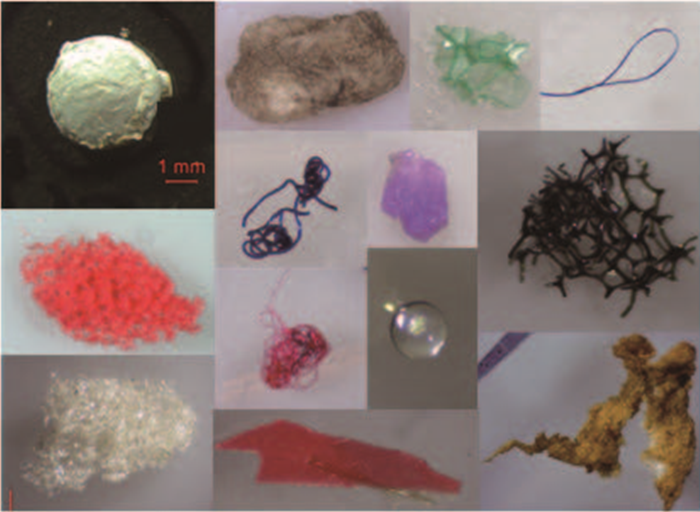
Figure 1-4. Various shapes, sizes, and colors of microplastic particles.
Source: Martindale, Weisberg, and Coffin (2020).
Particles with more irregular shapes may attach more readily to surfaces, including external and internal surfaces of living organisms (Lambert, Scherer, and Wagner 2017).
MP have a large surface area to volume ratio because of their small size. The proportional surface area increases as the MP particle size decreases. Typically, for a given mass of the same substance, spherical particles have the least surface area of all shapes, and fibers have the greatest surface area. As surface area increases, so does the adsorption of contaminants and fouling of the MP (Chubarenko et al. 2016). The adsorbed pollutants can subsequently leach back out into the environment or cause health and ecological effects if ingested or inhaled. Additionally, biofilms, which may be toxic, may develop on the surfaces of MP and thus present additional exposure concerns.
Crystallinity is the degree to which the polymer molecular structure is ordered and aligned, which affects other physical properties such as density and permeability. A higher degree of crystallinity typically results in greater strength. Plastics that are more crystalline include nylon (polyamide, PA), polypropylene (PP), and poly(p-phenylene terephthalamide), also known as PPTA or Kevlar.
The specific monomers, solvents, catalysts, and other additives used for the production of each type of plastic affect the physical and chemical properties of MP, as well as their reactivity and potential for sorption and leaching of chemicals. As a result, MP are increasingly being considered as a group of unique compounds, rather than a single compound.
1.4 Plastics Naming Conventions
Many types of plastics exist, each holding unique properties to fit a range of uses. A summary of common plastic polymers is provided in Table 1-1.
Synthetic fibers such as polyester, nylon, and acrylic are made from the same compounds used to produce plastics. Textiles made with these materials break down during production, care, and use, producing MP fibers. These fibers are included in the definition of MP.
1.5 Why Do We Care About Microplastics?
Microplastics are ubiquitous in the environment. They have been found in the air we breathe, the water we drink, and the food we consume. Microplastics pose a potential risk to humans and to wildlife through exposure to the chemicals in plastic and through physical impact (see Section 4 for detail). Humans may consume MP from many different sources—in products such as toothpaste that contain microbeads; in drinks stored in plastic bottles; in food that is packaged, stored, and microwaved in plastic; and in water from community water supplies or private wells, as well as other sources. MP are also consumed by animals and taken up in the roots and leaves of plants (Azeem et al. 2021), which, in turn, may be consumed by humans. MP may contain chemical contaminants or additives from the manufacturing process or adsorbed from the surrounding environment, as well as microbial pathogens from the environment (Cole et al. 2011, Yang et al. 2020). When MP are inhaled or ingested, any chemical additives or adsorbed contaminants are also inhaled or ingested and may adversely affect human health (Joo et al. 2021). Plastics and MP can remain mixed with soil and sediments for years before their physical redistribution in stormwater runoff, agricultural integration/uptake, or human/animal consumption. Most plastics have the potential to degrade to MP; thus, today’s plastics could be tomorrow’s MP. The Pew Charitable Trusts estimated a 40% growth in plastics production over the next decade, thus concerns relating to MP are likely only to increase in the future (Lau 2021).
1.5.1 Additives
There are many different types of polymers used to create plastics (see Table 1-2) and each one has unique properties. Although the physical presence of MP presents environmental and health concerns, the substances and chemicals added to the plastics may be concerning as well. The chemical additives used in plastics can cause physical effects or chemical effects. Additives, introduced during the plastic manufacturing process, can alter those properties to suit the requirements of a product. Common plastic additives can generally be grouped into four categories: colorants, fillers, reinforcements, and functional additives (Hahladakis et al. 2018). Detailed effects of MP (and their associated additives) on human health are discussed further in Section 4.
During the plastic manufacturing process, a small quantity of the additive(s) may be introduced. There are many different types of resins and polymers used to create plastics (see Table 1-2) and each one has unique properties. Common plastic additives can generally be grouped into four categories based on the effect to the resin: colorants, fillers, reinforcements, and functional additives (Hahladakis et al. 2018).
Table 1-2. Overview of common MP functional additives
Adapted from Bart (2005).
| Additive | Function | Example |
| Accelerators | Accelerate reactions in the manufacturing process to cross-link or break down polymers. | Also called activators, catalysts, compatibilizers, curing agents, initiators, promotors, scorch inhibitors or retardants, vulcanization accelerators, or vulcanization retardants |
| Acid scavengers | Neutralize acid residue from the manufacturing process. | Salts of weak acids |
| Adhesion promotors | Improve the adhesion of different materials (for example, polymers to inorganic substrates). | Also called coupling agents |
| Anti-blocking agents | Prevent or reduce plastic film from sticking together. | Lubricants, parting, or release agents |
| Anti-fogging agents | Prevent the formation of water droplets and increase the transparency and the polymer surface critical wetting tension. | |
| Antimicrobials | Protect plastic material against the growth of algae, bacteria, fungi, mold, etc. May include biocides and preservatives. | Used in PVC and polyurethane foams |
| Antioxidants | Inhibit the oxidation of organic materials in the manufacturing process; protect polymers, elastomers, foods, fuels, and lubricants. | Also called free radical scavengers, light stabilizers, peroxide decomposers, tackifiers, ultraviolet (UV) absorbers, or screening agents |
| Anti-radiation agents | Slow the degradation process resulting from gamma radiation. | Used in rubber industry |
| Anti-skinning agents | Control skin formation resulting from exposure to air. | Used in alkyd or oil paint |
| Anti-slip agents | Reduce surface friction, which allows one layer of film to slide easily over another. | Used in lubricants, slip agents, and surfactants |
| Anti-static agents | Reduce or eliminate electrostatic charge. | Used in static-free supermarket bags |
| Blowing agents | Generate or release gases into selected areas to create cellular structures during the manufacturing process. | |
| Bonding agents | Improve cohesion of two plastics. | Added to plasticized PVC so it can adhere to human-made fibers of polyester or polyamide to make waterproof fabric or tarps |
| Clarifying agents | Enhance the clarity, surface gloss or similar physical properties; may also be referred to as nucleating agents. | |
| Corrosion inhibitors | Remove active catalyst residues. | |
| Defoaming agents | Remove trapped gases from liquid mixtures during the manufacturing process. | |
| Degradation additives | Degrade plastic waste with biodegradation, chemical degradation, hydrodegradation, or photodegradation processes; includes photosensitizers and pro-oxidants. | |
| Diluents | Reduce viscosity while facilitating processing. | Used in epoxy resins |
| Driers | Accelerate autooxidation and hardening of coatings. | |
| Elastifying agents | Improve elasticity and cold temperature flexibility. | Used in cables, self-adhesive products |
| Exotherm modifiers | Reduce maximum temperatures reached during exothermic reactions. | |
| Flame retardants | Reduce flammability, slow down or disrupt ignition or smoke evolution, or alter the combustion process. Includes halogenated additives, intumescent additives, smoke suppressants, and spumific additives. | |
| Heat stabilizers | Prevent polymers from oxidizing and/or decompose oxidized products in the manufacturing process. | Also called process stabilizers |
| Impact modifiers | Improve impact strength and rigidness of the polymers. | |
| Initiators | Promote radical polymerization of polymers. | |
| Mastication agents | Lower viscosity by assisting in breaking molecular chains; includes peptizers and processing aids. | |
| Metal deactivators | Prevent metal-catalyzed oxidation during the manufacturing process. | Used in wire and cable applications |
| Odor modifiers | Mask undesirable odors or add scent. | |
| Photosensitizers | Increase the photodegradation rate by absorbing light. | |
| Plasticizers | Improve the flexibility of product. | |
| Processing aids | Coat the metal surface of a die, changing the interfacial properties between the metal and a polymer melt. | |
| Quenchers | Prevent polymers from degrading through photolysis. | |
| Shrinkage modifiers | Control shrinkage after molding. | |
| Thickening agents | Increase viscosity so that a liquid resin becomes a tack-free solid. | |
| Thixotropic agents | Modify viscosity or shear stress by producing low viscosity at high shear rates (for example, under kinetic conditions) or high viscosity at low shear rates (for example, under static conditions). | |
| Wear additives | Improve the ability of a base polymer to resist wear. |
Colorants, such as dyes or pigments, are chemical compounds that are used to alter the color of a polymer. The type of colorant that is used is based, in part, upon the type of polymer. For example, dyes, which are soluble colorants, are used to add color to polycarbonates (PC) and polystyrenes (PS), whereas pigments, which are insoluble, are used to add color to polyolefins. Use of specific colorants can also be based on the desired effect on the final product, such as fluorescent, metallic, pearlescent, phosphorescent, photochromic, or thermochromic, or the ultimate application or use of the end plastic, such as food, packaging, or toys (Hahladakis et al. 2018).
Fillers (sometimes called extenders, dispersing agents, homogenizing agents, or reinforcements) are inert material that add bulk to plastics, coatings, adhesives, and sealants (CROW 2022). In addition to providing a cost benefit by lowering manufacturing cost, fillers can also improve moldability and stability of the polymer, reduce thermal expansion, and increase the heat-deflection temperature (CROW 2022). Alumina trihydrate, barium sulfate, carbon black, calcium carbonate, calcium sulfate, clay, glass beads and fibers, kaolin, mica, and wollastonite are the most common additives used as fillers (CROW 2022).
Reinforcements used in plastics include carbon, glass, mica, aramids, and other materials in the form of particulates, fibers, mats, or fabrics that are added to plastics to increase strength or provide other beneficial physical traits (Rosato, Rosato, and Rosato 2004).
Functional additives are compounds that are added to plastics to enhance or alter existing properties of plastics or add new properties. These compounds are classified by the desired effect that the compound will have on the polymer. An overview of common functional additives is presented in Table 1-2.
Although the uses of plastic additives are regulated via many avenues, including under the U.S. Department of Agriculture for additives that may come into contact with food or beverage products (for example, 21 CFR Section 177), by the U.S. Environmental Protection Agency (USEPA) for additives considered toxic, and by Registration, Evaluation, Authorisation and Restriction of Chemicals (REACH) in Europe, such regulations are not focused on preventing adverse effects to the environment when plastics degrade or when additives leach from the plastics and enter the environment. Although the additives used in plastics manufacturing provide many benefits, these additives may also present potential toxic dangers and may contain regulated substances. As plastics slowly break down into the environment, the additives can leach out from the polymer/resin and mobilize into and migrate through the air, water, and soil. Leachates containing chemicals from plastics can accumulate or migrate in the environment; thereby magnifying the harmful effects of nano-sized plastic pieces by adding a toxic component (Tian et al. 2021). However, some studies have conflated the potential human health risk associated with consumption of species in which MP have accumulated as the chemical exposure risk is more so related to the chemicals that leach out of the MP rather than the MP themselves.
Because of the potential for human exposure, environmental persistence, and presence of chemical additives in MP, federal, state, and local authorities are looking to regulate MP (Sections 5.2.6 and 5.2.7).
1.5.2 Human Health and Ecological Effects
Exposure to MP may occur via ingestion or inhalation. The presence of MP in foods and beverages (including potable water), personal care products, and indoor and outdoor air has been well documented (Danopoulos et al. 2020a, Nicole 2021, Prata 2018, Revel, Châtel, and Mouneyrac 2018). Once taken into the body, adverse health effects may result due to the physical presence of MP, toxicity resulting from the presence of microorganisms concentrated on a biofilm surrounding the MP (Yang et al. 2020), chemicals adsorbed onto the MP, and/or direct toxic effects resulting from the chemical composition of the MP. The potential to cause human health or ecological impacts is influenced in part by the chemical and physical properties of the MP, including polymer type, particle size and shape, and the potential sorption of other chemical substances onto MP. The number of published studies showing adverse effects from MP exposure is increasing (Figure 1-5). Human health effects and ecological effects are discussed in greater detail in Section 4. Risk assessment associated with MP is challenging and is continuing to evolve. Conclusions derived from risk assessments of MP frequently lack consensus from the scientific community due to inadequate dose-effect and exposure data and associated data gaps.
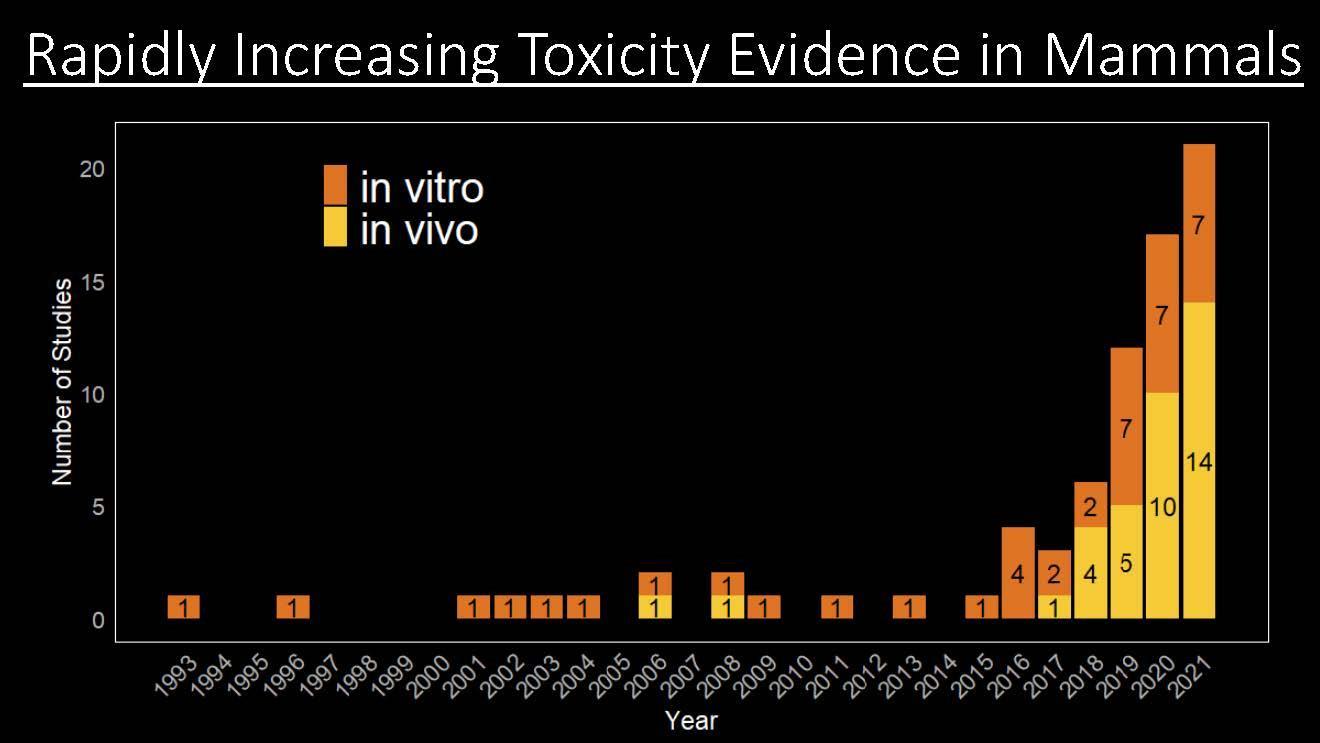
Figure 1-5. The number of studies showing evidence of toxicity in mammals is rapidly increasing each year.
Source: Coffin (2022).
1.6 Distribution of Microplastics in the Environment
1.6.1 Worldwide Distribution
MP appear to be ubiquitous in the environment and can be found around the world, including in ice from Antarctica and in sea salt (Auta, Emenike, and Fauziah 2017). MP have been identified in multiple media, including ambient air, surface water, groundwater, wastewater, wastewater biosolids, soil, sediment, and biota. The accumulation of MP varies geographically with many factors, including location, hydrodynamic conditions, environmental pressure, and time (Shahul Hamid et al. 2018).
Within the marine environment, MP appear to be generally present in greater abundance near the shore and close to urban areas than in waters located farther from developed areas (Bošković et al. 2022, Desforges et al. 2014), thus indicating a strong anthropogenic influence. Distribution of MP in nearshore areas is also affected by tides, currents, and rivers. The abundance of MP in the marine environment is particularly high in semi-enclosed, shallow marine waters such as the coasts of Louisiana, the northern Gulf of Mexico, and the Mediterranean Sea (Cózar et al. 2014). In more remote areas of the oceans, the distribution of MP is strongly influenced by currents, cyclones, and wind directions.
The presence of MP in freshwater bodies is largely affected by anthropogenic activity, with greater abundance of MP noted close to urban areas, wastewater treatment plants, or other sources. For example, a study performed by Estahbanati and Fahrenfeld (2016) documented significantly increased concentrations of MP downstream of wastewater treatment plants compared to upstream waters. Temporal variations in the amount of MP in fresh water and marine water have also been observed by many researchers with generally greater concentrations of MP observed during rainy seasons (Harris et al. 2022, Li, Wang, et al. 2021).
Studies also indicate rapidly increasing concentrations or abundance of MP in the environment. A study performed by Amélineau et al. (2016) measured the mean density of MP in the water column of Greenland and noted an increase from 0.99 items/m3 to 2.38 items/m3 from 2005 to 2014. Most MP research has been focused on the marine environment, but some studies suggest that the amount of MP released on land is up to 4–23 times the amount of MP released directly to oceans. MP accumulation on land is most significant in areas of strong anthropogenic influence, such as in urban areas (Horton et al. 2017).
1.7 Fate and Transport of Microplastics
MP may enter the environment via permitted or unpermitted point source releases, nonpoint source releases, or degradation of macroplastics. Point sources may include, but are not necessarily limited to, discharge of MP to surface water via outfalls, land application of biosolids or treated water containing MP, the use of fertilizers or pesticides containing micro-sized plastic particles, or discharge of air emissions containing MP. Nonpoint discharges include stormwater runoff, release of MP due to tire wear, atmospheric transport and deposition from nonspecific sources, degradation of macroplastics, or other mechanisms that are not tied to a specific source (See Appendix A.3). Although releases of primary MP do occur (see Appendix A-4), the degradation of plastic products and plastic wastes in the environment is considered a significant contributor to the volume of MP in the environment (Ivleva, Wiesheu, and Niessner 2017, Zhang, Hamidian, et al. 2021). The formation of MP from macroplastics may occur via physical and chemical weathering, but anthropogenic activities, such as laundering of textiles containing synthetic fibers, may also contribute MP to the environment.
Weathering processes may affect the plastic properties, making it difficult to trace MP to original sources and definitively determine their mechanism of release or pathway to the environment. Nevertheless, it is important to understand the original products and sources of MP to identify ways to reduce or eliminate the introduction of MP into the environment. The environmental fate and transport of MP are discussed further in Section 2 of this document.
As discussed in Section 1.3, the characteristics of MP particles may affect their transport in the environment. For example, the density of MP particles ranges from <0.05 g/cm3 for PS foam to 2.3 g/cm3 for PTFE and affects their transport in the environment. Low-density MP (for example, foamed PS, PS) float on water surfaces and are exposed to winds, waves, and currents, with wind being the most important factor for transport. As such, low-density MP may travel rapidly in the environment and may be transported long distances. By contrast, high-density MP tend to be less mobile in the environment. Low-density MP are also found in sediments, suggesting that biofouling causes an increase in density and contributes to a loss of buoyancy and sinking (Chubarenko et al. 2016). Recent studies have shown higher proportions of high-density polymers in offshore waters, suggesting that high-density MP can travel greater distances in surface waters than previously thought (Eo et al. 2021).
1.8 Environmental Justice and Microplastics
Environmental justice (EJ) is the “fair treatment and meaningful involvement of all people regardless of race, color, national origin, or income with respect to the development, implementation and enforcement of environmental laws, regulations, and policies” (USEPA 2021b). Although further research is needed to fully understand the health impacts of MP in general, and on specific subpopulations, the topic of EJ as it relates to marine litter and MP is of growing concern (UNEP 2019). On local to global scales, the current efforts to adequately manage and decrease plastic pollution are insufficient to address the specific needs of various groups who are already in vulnerable situations, and are socially, economically, politically, institutionally, or otherwise marginalized (UNEP 2021a).
The United Nations (UN) reports marine litter, including MP, as a major EJ concern. “Vulnerable communities, including those who depend on wild seafood for their diet, face greater risks to their health and livelihoods from marine litter and microplastics.”(UNEP 2019) Each year, around 8 million metric tons of plastic are dumped into the ocean; MP account for approximately 3% of this pollution but have the potential to have significant impacts on human health (PEPH 2020). In some countries, such as Fiji, up to 80 percent of land-based litter ends up in natural waters. Other developing countries, like Haiti, have no wastewater treatment and limited waste management options.
1.8.1 Impacts over the Plastics Life Cycle
When considering the impacts of MP on various populations, it is critical to consider the full life cycle of plastics from production to consumption to disposal, as well as the fact that the responsibility of contamination spans a complicated range of stakeholders that includes plastic producers, manufacturers, consumers, waste handlers, and governments (Eriksen et al. 2018). Therefore, the full cost of plastics must consider the range of social and EJ concerns as inequitable burdens of environmental and health impacts imposed on communities across the life cycle of plastics (see also Section 6.1 for additional details). Further, waste reduction and materials management strategies should be inclusive of local communities with EJ concerns (USEPA 2021c). Illustrative examples of EJ considerations across the plastics life cycle and population groups at increased risk are provided in the following sections.
1.8.1.1 Production
The vast majority of plastics are produced from petrochemicals, which are sourced from fossil fuel extraction through mining, fracking, or drilling of coal, oil, and gas; further, due to the localization of fossil fuel production and the logistic complexities of transport, plastic production is often concentrated in regions where fossil fuel development is present (CIEL 2017, UNEP 2021a). Extraction and refining of fossil fuels, such as hydraulic fracturing for natural gas, may release toxic substances into the air, water, or soil and impact nearby communities (CIEL 2019). Fossil fuel exploration and development have impacted indigenous peoples around the world related to land tenure (UNEP 2021a). Potential occupational exposure across the plastics supply chain, particularly among industrial workers, should also be considered, as studies have indicated occupational exposure to airborne MP in workers of synthetic textiles and the vinyl chloride or PVC industries (Prata, da Costa, et al. 2020). Most communities next to industrial facilities in the United States are disproportionately occupied by low-income individuals and communities of color who have faced a legacy of systemic disadvantage and inequitable burden of health impacts resulting from environmental contamination (CATF 2017).
1.8.1.2 Consumption
The societal demand (by some) for single-use plastics and corporate decision-making relating to, for example, excessive packaging, further increases the plastic burden, resulting in greater volumes of plastic requiring disposal and increased plastic production (NASEM 2022). Regulations limiting MP have focused primarily on single-use plastic bans (Karasik et al. 2020) and primary MP legislation (Congress.gov 2015). Specific regulations are included in the regulatory context section (Section 5).
There have been efforts in some communities to ban or disincentivize single-use plastics, and there is a recent push to more circular economy efforts, which could include consideration of the use of sustainable alternatives and improved collection and upcycling of plastics, going beyond recycling efforts to maximize the value of products and materials for as long as possible and avoid potential contamination, toxicity, and pollution (Bucknall 2020). However, sustainable or green alternatives are not always equally accessible to all populations, including low-income populations.
1.8.1.3 Disposal
Given existing solid waste management infrastructure and practices, plastic waste is typically managed by being disposed of to a landfill, incinerator, or recycling facility. Most often, such facilities are sited in economically disadvantaged communities (The New School 2019). The current suite of plastics waste management technologies, including incineration, co-incineration, gasification, and pyrolysis, may result in the release of toxic metals, gases, and substances into the air, water, or soil, and thereby may lead to either direct or indirect exposure to frontline or fence line communities (CIEL 2019).
Poor solid waste management practices can contribute to the release of plastics and MP to the environment. In developing and low-income countries, waste management challenges or gaps (for example, the lack of adequate solid waste collection and management) can result in greater mobilization of plastics to the environment, and thus, greater MP exposure for these populations.
1.8.2 Effects on Sensitive Populations
Certain portions of the population may be more susceptible to potential health effects resulting from exposure to MP. These include women, communities that rely on subsistence fishing/aquaculture and farming/agriculture, children, those relying on aquatic ecotourism, residents of countries with less developed waste management programs, individuals living closer to sources of MP, and individuals who rely more heavily on plastic products due to lack of choice or due to convenience.
- The nexus between the plastics life cycle and socioeconomic factors has myriad direct and indirect effects, including ecosystem devaluation and loss of tourism (NASEM 2022), particularly for island and coastal communities. Communities, including indigenous groups or those relying on wild seafood or marine mammals for their diet, may face greater risks to their health and livelihoods from marine litter and MP, and the chemicals that may leach out of plastics, which can be more concentrated (UNEP 2021a).
- With regards to exposure from household sources, women face a higher burden of exposure to plastics and MP due to differences in biology, social roles, and political power in regulating plastic use and health standards. Plastics have become more prevalent in our daily lives and are encountered more frequently through items such as cosmetics, personal care, and feminine hygiene products (UNEP 2021a).
- Physiological and behavioral differences in children may also result in greater exposure in some instances. Recent studies discovered that infants have 10–20 times higher concentrations of MP in their feces than adults (Zhang, Wang, et al. 2021), and including meconium and placenta (Braun et al. 2021, Ragusa et al. 2021). Recent studies have also demonstrated the presence of MP at playgrounds, which can be attributed to the deterioration of plastic play equipment (Koutnik et al. 2023) and rubberized play surfaces (Olshammar et al. 2021) The potential impacts of MP on children and the uncertainty regarding lifetime accumulation of MP are unresolved and require further research.
1.8.3 Environmental Justice, Taking Action
EJ issues with complex environmental challenges such as plastic pollution are difficult to address because they often transcend environmental, public health, human rights, and other boundaries (Osofsky 2004). Nevertheless, EJ considerations must be considered when assessing the health and socioeconomic impacts of MP. The UN recommends that countries develop and implement programs focused on environmental conservation and creation of awareness of the negative effects of MP. The UN also recommends that governments seek the opinions of indigenous peoples when developing environmental protection policies and provide transparency to all stakeholders, but especially to affected communities (UNEP 2022a). The USEPA established America’s first national recycling strategy for plastics in 2021, noting the production of about 300 million tons of plastic waste annually around the world. The draft USEPA plan acknowledges EJ concerns and places priority on addressing the impacts of recycling on poor and minority communities (USEPA 2022e). More specifically, the plan calls for the transformation of waste and materials management in the United States, including actions to address challenges facing the recycling system, both domestic and international, and engagement of community and tribal stakeholders in affected communities.
“We recognize the burden that living near waste and waste-related facilities can have on communities when waste is not properly managed, which can lead to higher levels of chronic health values.”
1.9 Acknowledgment of the Evolving State of the Science
MP are considered an emerging contaminant of concern and as such, the state of the science is evolving rapidly. The USEPA acknowledges that MP are an emerging contaminant that may pose human health and environmental risks (Potter 2021). Challenges relating to MP include the following:
- Difficulty in comparison of MP studies. Focus on MP has increased significantly since 2004, with the number of publications relating to MP increasing from no publications in 2004 to over 1,700 publications in 2020 (Qin et al. 2020). Researchers have found that, as with many developing disciplines, the reliability of study findings in publications relating to MP studies is significantly variable. Comparison of data between studies has been complicated by variability in how MP are defined, a lack of standardized test methods, and even differences in the units used to report the presence of MP in various media. As such, researchers, government officials, media, and others are challenged with verifying the reliability of publications and data relating to MP.
- MP fate and transport. Additional study is required to better understand the environmental fate and transport of MP (see Section 2 for more information).
- Representative sampling and analysis methods. MP sampling and analytical methodologies are still being developed and evaluated. Standardized sampling and analytical methods have not been adopted by many regulatory agencies. Also, synthesis of MP reference standards is necessary to support exposure studies. Sampling and analytical methods are discussed further in Section 3 of this document.
- MP toxicity and health effects. The toxicity of MP is not well understood, and limited information has been collected relating to long-term biological effects. Challenges relating to the current state of understanding of toxicity and human health effects are discussed further in Section 4 of this document.
- Determination of an appropriate framework for risk assessment. Further consideration of an appropriate framework for risk assessment associated with polymeric materials is needed to determine whether the risk associated with MP should be evaluated based on the risk associated with individual chemicals or whether a different approach would be more appropriate. Risk assessment approaches are discussed further in Section 4.7 of this document.
MP can result in complex and wide-ranging physical and chemical effects but understanding of long-term biological effects is very limited. Further, in combination with climate stress, MP may result in multi-stressor impacts, particularly in densely populated urban areas; these stresses may affect the long-term health and resilience of ecosystems.
2 Environmental distribution, fate, and transport
To better understand the complexities of MP pollution, we need to understand its distribution, as well as its transport pathways and fate in the environment. Understanding these concepts is crucial in developing management strategies and policies to remediate and reduce MP pollution. Select a red dot on Figure 2-1 to learn more about the distribution, fate, and transport in various environmental media.
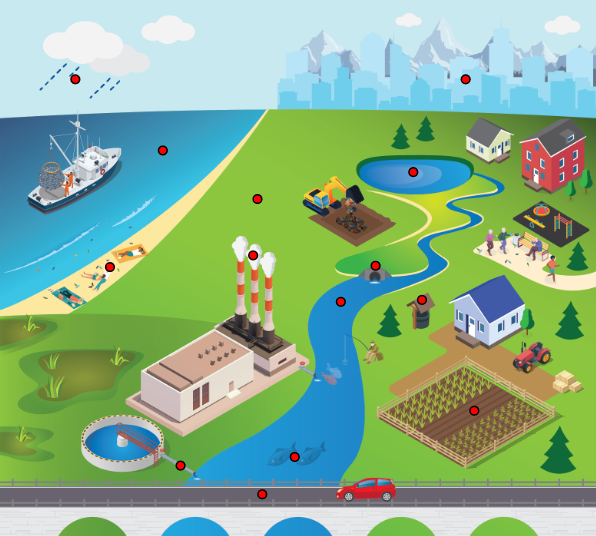
Figure 2-1. Site conceptual model for the environmental distribution of MP.
Source: Jonathan McDonald and the ITRC MP Team
Plastic waste and MP are found ubiquitously throughout the world, in soils, sediments, waters (oceans, lakes, rivers, groundwater), the atmosphere, and at the northern and southern extents of the planet in the polar ice caps. Plastic wastes enter the environment through various forms of disposal and incidental (both accidental and non-accidental) releases. Physical characteristics (for example, size, shape, density) and chemical components (for example, polymer type, additives) are critical in further understanding the distribution, transportation, and fate of MP in the environment.
Sources of MP can be broken into “primary” and “secondary.” Similar to other pollutants, MP can enter the environment through point or nonpoint sources.
2.1 Primary vs. Secondary MP
MP found in the environment can be classified as primary or secondary (Figure 2-2). Sources of primary MP include MP production facilities, as well as product manufacturing facilities where MP are used as components of industrial or commercial products. Secondary MP are generated through the physical, chemical, and biological alteration/degradation of larger pieces of plastic. Degradation of plastic wastes in the environment is considered to be one of the major processes contributing to the accumulation of MP in the environment (Ivleva, Wiesheu, and Niessner 2017, Zhang, Hamidian, et al. 2021). Other processes include the use and processing of plastic-containing materials, such as washing of synthetic fabrics (see Appendix A.6) and abrasion of tires on the road surface.
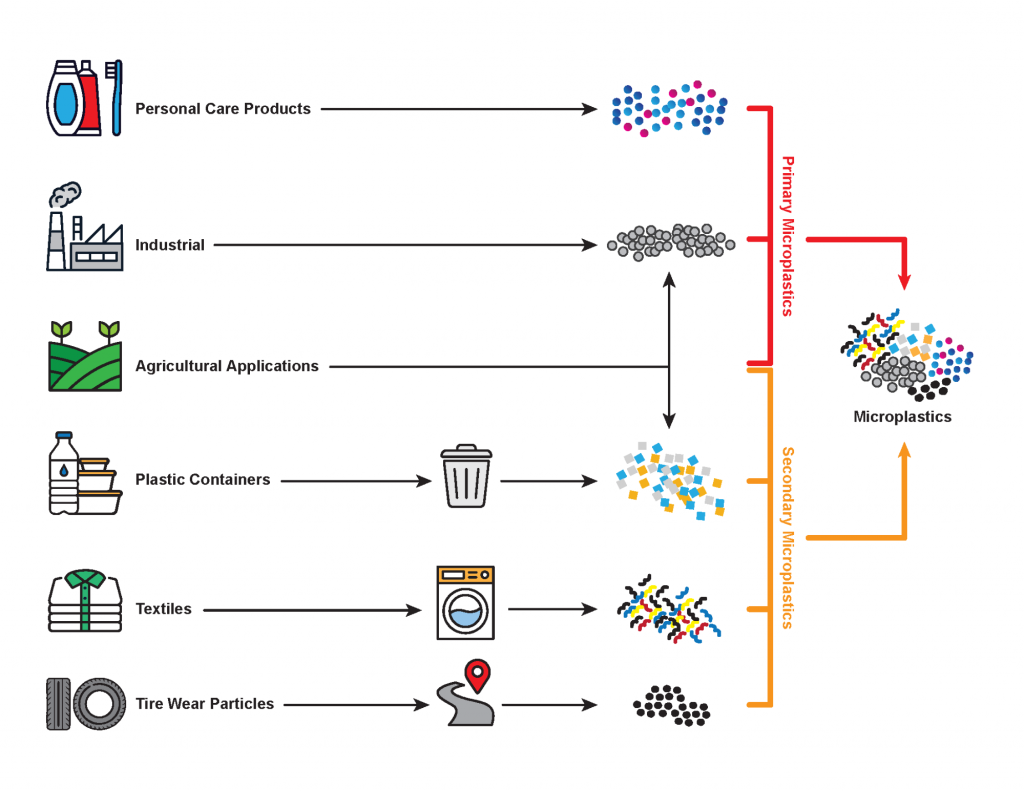
Figure 2-2. Primary and secondary microplastics and examples of associated sources.
Source: Johnathan MacDonald
2.1.1 Primary Microplastics
Primary MP are tiny plastic particles that were designed specifically for their use in industrial and commercial products. Examples include nurdles and fertilizer pellets. Primary MP can enter the environment through spills or other incidental releases during manufacturing or shipping, or in the waste streams associated with the manufacturing process. For example, MP can be released directly to the atmosphere through process air discharges or to water bodies as a component of industrial wastewater. Sources of primary MP are also found in personal care products and cleansers that contain MP beads as a component of the product (facial cleanser, toothpaste, and makeup), and can be released during or as a result of product use. Primary MP are applied to agricultural fields in the form of polymer-coated nutrient prills.
2.1.2 Secondary Microplastics
Secondary MP are generated through the chemical and physical degradation of larger plastic products already in the environment, such as through the breakdown of synthetic fibers and consumer products (for example, water bottles, plastic bags, cigarette butts), industrial/ construction products (for example, paints, plastic sheeting), washing and drying of synthetic textiles, tire wear, and recreational wastes (for example, fishing line). Synthetic fibers that have been found to be most common sources of MP include P, PE, PP, and PVC.
The plastic degradation process is important in determining the fate and effects of MP on the environment. The size distribution of plastic particles in the aquatic environment is impacted by a variety of factors, including biofouling (growth of a biofilm over the plastic, increasing its buoyancy or density, depending on its size and shape) and aggregation, flocculation, fragmentation, the time of residence, and transportation routes (Darabi et al. 2021).
Photodegradation is recognized as the most important process that initiates plastic degradation on the surface of land or water, whereas biodegradation by microorganisms is the main cause of plastic degradation in seawater in the aphotic (no light) zone (Khoironi et al. 2020, Zhang, Hamidian, et al. 2021). Although not all (Henry et al. 2018), most plastics are subjected to abiotic and biotic degradation processes involving chemical, physical, and biological reactions in the environment. Additionally, photodegradation has the ability to cause oxidation and chain scission (degradation of the polymer chain), forming low molecular weight degradation products and causing changes in physicochemical and mechanical properties (Zhang, Hamidian, et al. 2021). Other abiotic degradation processes (for example, heat, mechanical, chemical), along with biological degradation and disintegration, also convert plastic wastes into MP that are then distributed throughout the environment through various transportation vectors.
2.2 Point and Nonpoint Sources
Although the discussion of sources of primary and secondary MP addresses the types of MP that are being released, point vs. nonpoint sources show us specifically where these releases are coming from. Point sources of MP enter the environment from a single place, while nonpoint sources of MP enter the environment from many different places at once. These MP are then transported throughout the environment through atmospheric and fluvial pathways. Wind and stormwater runoff are believed to be the main mechanisms that transfer plastics from land to water. Additionally, overland flow following precipitation events can transport MP from land application areas to nearby water bodies (Zhang, Ma, et al. 2021). Some MP can even migrate vertically along with the percolating stormwater and eventually reach groundwater, where they can be transported downgradient, away from the source area. This means that they can travel significant distances from their depositional origins and impact communities and ecosystems that are geographically removed from where they were originally released.
2.2.1 Point Sources
Point sources of MP include industrial and municipal wastewater outfalls, stormwater outfalls, and industrial smokestacks. Untreated outfalls can discharge MP directly to local surface water bodies where they can be transported downstream to lakes, estuaries, and eventually bays and oceans. In countries where wastewater is treated prior to discharge, 72% of MP on average is removed during primary treatment and 94% on average in wastewater treatment plants (WWTPs) where tertiary treatment is used (Iyare, Ouki, and Bond 2020). Mak et al. (2020) identified local MP in the sewage treatment and stormwater outfalls into Victoria Harbor, Hong Kong, at concentrations up to 10,816 pieces/m³. Plastics consisted mainly of PE and PP and were being discharged at an average rate of 3.5 mg per capita per day. Treilles et al. (2019) investigated MP in stormwater at the outlet of an outfall located in Sucy-en-Brie (Paris suburb, France). Preliminary results showed MP concentrations were in the range of 4,600–93,000 fragments/L, in which PA and PE predominated.
The MP removed through treatment end up in the biosolids, which are typically incinerated, disposed in landfills, or spread out to dry and mixed in with soils as amendments (for example, to agricultural fields). During the drying process, MP can be dispersed throughout the environment by the wind.
Within the marine environment, point sources of plastics include material lost or discarded from commercial and passenger ships, as well as aquaculture facilities (Karbalaei et al. 2018). Additionally, some marine paints contain synthetic polymers that can leach/erode from the paint and enter the environment (Karbalaei et al. 2018).
2.2.2 Nonpoint Sources
MP nonpoint sources are more difficult to identify and address. This is because they can enter various areas of the environment through large-scale events such as stormwater runoff, atmospheric deposition from storms, and land application of biosolids (Su et al. 2020). In fact, urban stormwater runoff from heavy precipitation events or floods, winds, and wildfires can lead to MP being removed from various areas all at once, such as construction areas, artificial turf and rubber running tracks, and landfills (Bailey et al. 2021).
The most important sources of MP in the air are determined to originate from synthetic textiles, erosion and abrasion of synthetic rubber tires, and city and household waste (Prata 2018). Other sources of airborne MP include waste incineration, landfilling (Dris et al. 2016), industrial air emissions, sewage biosolids (commonly used in agriculture as a fertilizer), construction materials, and household dryer exhaust (Prata 2018). Werbowski et al. (2021) studied 12 watersheds around San Francisco Bay. Their results showed MP in all stormwater runoff sampled, with concentrations ranging from 1.1 to 24.6 particles/L (higher than those typically found in wastewater treatment plant effluent). Werbowski et al. (2021) reported fibers and black rubbery fragments (potentially tire and road wear particles) as the most frequently occurring morphologies, comprising approximately 85% of MP in the samples. Liu, Tang, et al. (2019) found MP (primarily P, PE, PP, PS, and PVC) in the water column of stormwater treatment ponds in North Jutland, Denmark. The results showed that ponds capturing highway and residential area runoff had the lowest MP concentration, while ponds serving areas with industry and commerce had the highest. The study also noted that ponds collecting residential stormwater generally held the largest sized MP particles. According to Liu, Tang, et al. (2019), the data demonstrate that stormwater retention ponds act not only as MP sinks but also play a role in the transport of MP from land to the aquatic environment.
2.2.2.1 Tire Wear Particles
Tire wear particles (TWP) have been detected in many environmental media, including ambient air, road dust, and terrestrial soil and sediment, as well as in marine and freshwater aquatic environments (Baensch-Baltruschat et al. 2020, Leads and Weinstein 2019, Panko et al. 2013, Panko et al. 2019, Unice, Kreider, and Panko 2013, Wagner et al. 2018). Some of the chemicals contained in TWP have been reported to have significant impacts on migrating aquatic life (for example, coho salmon, Appendix A.5).
Physical properties, including size, shape, and particle density, will impact the fate and transport of TWP and therefore, overall distribution in the environment (Unice et al. 2019). Fate and transport potential also relies on the regional weather conditions and the soil and hydrologic characteristics of the environment (Wagner et al. 2018). Furthermore, the generation of TWP depends upon the vehicle type, tire type, service life of the tire, and vehicle operations and patterns such as speed and acceleration (Baensch-Baltruschat et al. 2020, Kreider et al. 2010, Wagner et al. 2018). Emitted TWP have the potential to be dispersed in ambient air, then deposit as roadside dust or in roadside soil and be transported to surface water through runoff and erosion then to open water bodies or wastewater treatment facilities (Unice et al. 2019). TWP are generally found more frequently and in higher quantities near roadways and urban areas, particularly those with high-volume traffic patterns (Unice, Kreider, and Panko 2013).
2.2.2.2 Agricultural Sources
Another nonpoint source of MP to terrestrial and marine environments is fragmentation of plastics that are used in agriculture (Karbalaei et al. 2018). MP in agricultural soils have recently gained significant attention in science and society. In addition to sewage sludge and compost, MP are contained in agricultural products (for example, plastic-coated agrochemicals, plastic mulches, silage, and fumigation films, fertilizer sacks) that are added to soils (Karbalaei et al. 2018, Muise 2016). However, knowledge about how much MP has been applied to agricultural soils is scarce (Brandes, Henseler, and Kreins 2021). Modeling efforts indicate that MP distribution in soils is place-dependent, and a spatial understanding of the source materials is needed.
2.3 MP in the Fluvial Environment
Inland waters, urban lakes, and riverbanks have been found to be more susceptible to plastic (macro and micro) pollution, while in the marine environment, ocean current convergence zones, beaches, and seafloors are likely depositional environments for MP. Generally, lakes and inland areas of decreased flow velocity act as MP sinks, whereas rivers and streams serve as MP transport systems. Because MP are translocated by water currents and their vertical distribution is regulated by particle density and biofouling, it is difficult to precisely identify the source of plastic particles in the aquatic environment (Darabi et al. 2021). Aquatic sediments, particularly deep marine sediments, are considered as the final sink of MP pollution. The abundance of MP in deep marine sediment is usually higher compared to terrestrial soil and water bodies (Darabi et al. 2021).
Although plastics in most scenarios have been transported from land to water, they can also be transported from water to land (Moreira et al. 2016, Turrell 2018, Zhang, Chen, et al. 2019, Zhang, Hamidian, et al. 2021, Zhang et al. 2016). Studies suggest that ocean-atmosphere exchange plays a role for the MP in soils (Allen et al. 2020). MP may have been transported to the sea by wind, while it is possible that wave action and wind on the shoreline entrained and carried MP from the shoreline to land. MP may seep into the sea floor and accumulate in the sediment on the bottom of ocean (Barrett et al. 2020). MP may also concentrate in between vegetation—leaves, grasses, and roots in mangroves, seagrass, forests, etc. (Huang, Xiao, et al. 2021).
It is important to note that the transport processes may not be one-way among different media. Figure 2-3 below provides a conceptual transport mechanism among terrestrial land, fresh water, and the marine environment (Horton et al. 2017).
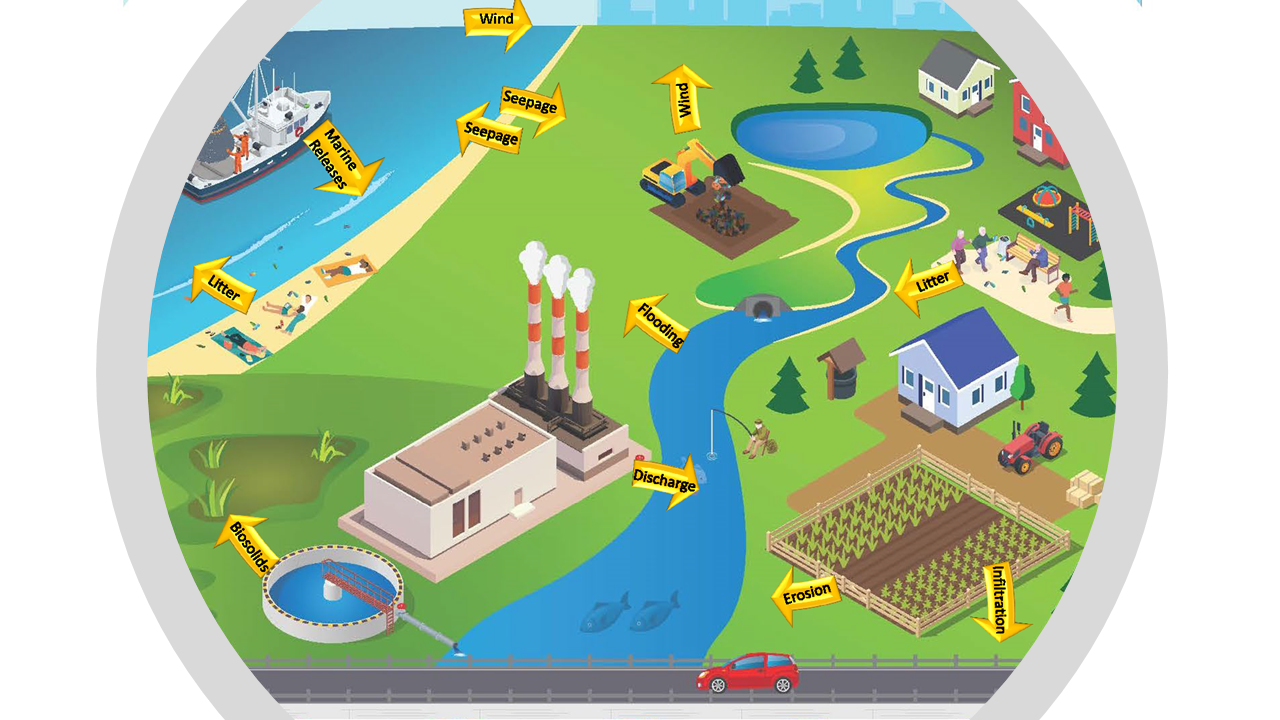
Figure 2-3. Movement of MP in surface waters.
Source: Jonathan McDonald and Todd Miller
2.3.1 Surface Water
MP have been found in freshwater systems across the globe. MP in freshwater systems can originate from a variety of point and nonpoint sources, such as atmospheric deposition, groundwater infiltration, stormwater runoff, and industrial and municipal wastewater discharges. MP concentration in freshwater bodies can vary by orders of magnitude, with urban streams and glaciers having the greatest concentrations of MP (Koutnik et al. 2021). Treatment of industrial and municipal wastewater sources directly affects the volume of MP entering surface water bodies (Appendix A.2, A.4, and A.5).
2.3.1.1 Rivers, Lakes, and Streams
In surface water bodies, MP are prevalent at the surface, throughout the water column, and in sediments, with their distribution dependent on multiple factors, including wind, currents, streamflow rate, and temperature (Petersen and Hubbart 2021). Flow rates in freshwater systems can impact the spatial distribution and concentrations of MP. Areas of decreased velocity can result in accumulation of particles as well as deposition into underlying sediments, whereas areas of high flow rate can result in more transport and possible resuspension of settled particles. Similar to other pollutants, lakes and areas of decreased flow velocity act as sinks, whereas rivers and streams (higher flow velocities) will tend to act as conveyance systems (Petersen and Hubbart 2021). Lakes and low-flow streams in urban areas are particularly susceptible sinks for secondary MP.
Rivers transport MP from their sources to the terrestrial boundary and across the boundary to the ocean. Rivers collect MP from wastewater treatment plant discharges, urban stormwater discharge points, runoff from land surface, and air deposition. Koutnik et al. (2021) found that fiber percentage in the MP samples also varied between locations. The urban water bodies had more fibers than the coastal region, indicating fiber fraction in water decreases downstream. Urban water bodies are expected to contain more fibers because of their release from textile products. Due to their long aspect ratio, fibers can be preferentially removed by aggregation during transport through the environment. Koutnik et al. (2021) also reported that the fiber fraction (compared to plastic particles) increases in water, indicating that fibers are more likely to float in water than nonfibrous MP. Thus, it appears that the shape of the MP, which influences buoyancy, will affect their fate in surface waters.
2.3.1.2 Stormwater
In most urban environments in the western United States, rainfall and runoff wash silt, sediment, and debris into stormwater collection systems that discharge directly to receiving waters without treatment (Moran et al. 2021). Separate stormwater collection systems increase the contaminant load, including MP, that discharge, into our lakes, streams, and bays. MP can be deposited onto the land surface through incidental action (for example, littering, aerial deposition), intentional application (for example, biosolids, agricultural amendments, and plastic covers), and product degradation (for example, tire wear particles). Once present, these plastics and MP can be entrained into stormwater runoff, which then drains to collection systems, lakes, streams, or other low-lying areas. Koutnik et al. (2022) conducted laboratory experiments showing the possibility for freeze-thaw cycles to drive denser MP, such as PET and PVC, to move deeper into the subsurface beneath stormwater treatment systems and consequently elevate groundwater pollution risk.
2.3.1.3 Bays and Estuaries
Bays and estuaries provide an important insight into the fate and transport of MP. Because they act as transitional areas between aquatic and terrestrial habitats and are uniquely located in between fresh and saltwater sources, they are important hubs for MP transportation around the world (Liu, Tang, et al. 2019). Additionally, due to their alternating hydrodynamic conditions, they are considered an important site for understanding the transition of macroplastics into microplastics. This is predominantly due to their ability to act as a sink for larger plastic debris (Yao et al. 2019). Furthermore, MP in wetland environments have been found to be directly derived from the population centers surrounding them (Govender et al. 2020). This means that estuaries contain both primary and secondary sources of MP that can be studied.
Mangrove swamps, productive habitats that act as valuable nurseries for fish and invertebrates, perform as important coastal protection systems and provide crucial natural filtration. These factors make mangroves a vitally important coastal resource for socioeconomic
purposes, with thousands of people depending on them for survival (Samidurai, Saravanakumar, and Kathiresan 2012).
Mangroves have dense and developed roots that grow in clay-rich environments that contain a high amount of organic matter. This makes them an important filtration mechanism, ultimately allowing these estuaries to act as MP sinks (Maghsodian et al. 2021, Martin et al. 2020). In fact, the abundance of MP in the mangrove ecosystems has been found to be 4–10 times higher in the water column, and 2–3 times higher in the sediments, than that of other ecosystems (Liu et al. 2022). Studies have also shown that the accumulation of MP in these areas has the ability to alter their environments by negatively affecting various soil properties (Qi et al. 2020).
With mangroves and other estuary ecosystems acting as a large food source and as MP sinks, it may be possible for them to bioaccumulate in the foods that we eat. Crustaceans, mussels, and other deposit feeders living in these environments have an increased chance of ingesting the MP found there (John et al. 2022). Cluzard et al. (2015) studied the key shellfish-growing regions in Baynes Sound, British Columbia, and detected MP in sediments and shellfish tissues. Results showed that MP alter the cycling of key nutrients, such as ammonium within intertidal sediments, and increase the amount of ammonium within the water column. Increased ammonium amounts in the water column can lead to eutrophication and trigger red tides (that is, algal blooms that grow rapidly) that are toxic to marine life and humans due to the chemicals they produce (Cluzard et al. 2015).
2.3.2 Wastewater
Industrial and domestic products have become two of the most rapidly growing sources of MP entering municipal wastewater systems today. Examples of industrial and domestic sources include polymeric fibers released by washing of synthetic clothing (during manufacturing and domestically), manufacturing and use of agricultural products and paints, and manufacturing and use of hand, body, and facial cleansers (Tagg et al. 2015, Zhu, Huang, et al. 2021). Other factors, such as plastic abrasion during dishwashing and MP entering sewage systems during rainfall events, also contribute to the presence of MP in industrial wastewater. This increased use of domestic products containing MP particles increases the chances for MP to reach the environment through direct discharge to water bodies, or as a wastewater treatment byproduct, such as biosolids.
WWTPs play a pivotal role in removal of MP particles before the waste streams are discharged into aquatic environments, yet between 50% and 80% of the global wastewater discharged to aquatic systems remains untreated (Uddin, Fowler, and Behbehani 2020, United Nations 2017). Even when wastewater is treated, there are no standardized treatment or analysis process specifically for MP removal.
The efficiency of MP removal in wastewater treatment plants ranges from 50% to 78% during primary treatment, and between 88 and 99.9% during secondary and tertiary treatment (Flinders 2020), indicating a high potential for capturing most of the MP currently being discharged into aquatic systems today. However, MP removed from wastewater are concentrated in the biosolids produced as a byproduct of the treatment process (Uddin, Fowler, and Behbehani 2020), and can be re-released into the environment through recycling efforts (for example, land application of biosolids, composting operations). Common MP shapes in wastewater, and hence in the biosolids, include fibers from textiles, pellets and flakes from industrial and domestic sources, and films. The land application of biosolids and disposal in landfills are of an increasing concern.
A study published in 2021 detailed that MP taken from wastewater effluents were predominantly (roughly 90%) smaller than 0.5 mm (Ragoobur, Huerta-Lwanga, and Somaroo 2021). The study took place at three WWTP in Mauritius, an island in the Indian Ocean. After water is treated in a Mauritius WWTP, it is discharged to the ocean, surface water, groundwater, or land (with more than 10% being used for agricultural activities). After treated wastewater is used for agriculture, MP has the potential to enter the food chain, and ultimately the human body. As treated wastewater is discharged into the ocean, the MP can circumvent the world’s waterways through the various ocean currents. As a response to the increase in MP in the WWTPs, Mauritius banned the use of plastic bags in the Environment Protection Regulation of 2015, which took effect in March 2021.
Another study published in 2021 details the prevalence of MP entering the South Saskatchewan River in Canada. Most of the MP extracted from the WWTP effluent were found to be synthetic microparticles (for example, MP associated with discharges from routine laundry activities) and were captured using fine-meshed plankton nets (Prajapati et al. 2021). The results showed on average a total of 141 million MP particles being discharged into the South Saskatchewan River every day. The WWTP responsible for the discharge is a Class 4 plant, which is the highest certification in Canada (Prajapati et al. 2021). This study demonstrates that WWTPs may not be effective at removing all of the MP from the treated wastewater, and the authors suggest that there is growing consensus that these particles are going undetected in WWTP effluent (Prajapati et al. 2021).
2.3.3 Groundwater
Based on the limited number of studies, and the fact that many wells are constructed or sampled with a variety of plastic materials, it is difficult to have a full understanding of the prevalence of MP in groundwater (for example, sources, abundances, polymer types, factors). According to Koelmans et al. (2019), groundwater appears to have the lowest abundance of MP compared to other water types (for example, wastewater effluent, lakes, streams, tap water, and bottled water), but more quality data are needed for better comparison due to lack of standard sampling and analysis methods (Koelmans et al. 2019). The environmental factors that impact MP migration in groundwater include particle size, density, soil moisture content, pH, salinity, and ionic strength.
MP in groundwater have been documented in limited studies, which have reported the presence of MP in groundwater systems in the state of Illinois and in Germany and South Africa (Bouwman et al. 2018, Mintenig et al. 2019, Panno et al. 2019). In these studies, the reported average concentrations ranged from 0.0007 particles/L (in Germany) to 15.2 particles/L (fibers reported in Illinois). The size of MP ranged from 0.45 µm (Illinois) to greater than 1.5 mm (Potchefstroom, South Africa) for fibers, and 50 µm (Germany) to 600 µm (Potchefstroom, South Africa) for fragments. MP have been found in shallow and deep groundwater. Mintenig et al. (2019) identified MP such as P, PA, PE, PVC, and epoxy resin (in sizes of 50–150 µm) in raw water extracted from wells approximately 30 meter deep near Hodorf, Germany. As mentioned above, due to lack of standard sampling and analysis methods, the quantity, types, and sources of MP reported under these types of scenarios should be further verified.
The Shi et al. (2022) study in northern China indicates that MP, including PA, PE, PP, PS, and PVC, were found in all of the groundwater samples collected, with the higher concentrations reported around sewage treatment plants, landfill sites, and vegetable production sites. Microplastics ranged in size from less than 20 μm to greater than 500 μm, and the largest was 2,500 μm. Eighty percent of MP particles sizes were less than 50 μm, consisted of fragments and fibers, and had a transparent color. The study found a correlation between MP and antibiotics (antibiotics in groundwater can result from WWTP discharges) and concluded that the MP can bind to antibiotics “through hydrogen bonding, hydrophobic interaction, van der Waals forces and electrostatic interaction mechanisms,” and can reduce the decomposition of antibiotics in soil and water.
Panno et al. (2019) concluded that crevices, conduits, branch-work caves, fractures, and sinkholes within geological formations may act as preferential pathways for MP migration from surface water to groundwater. Due to the irregular surfaces of fractures and crevices from retardation and the filtration effect, only the smaller size fractions of MP would migrate into groundwater. Bouwman et al. (2018) in their studies concluded that the size class profiles seem similar between soils and groundwater (size decreasing over the depth of soil or groundwater where MP are present); however, in groundwater, fragments found were smaller, whereas fibers found varied broadly in their sizes. The results suggest that groundwater susceptible to pollution by surface water may be more likely to contain MP.
Re (2019) indicated that MP can be introduced into an aquifer from losing streams, where stream water recharges the aquifer, and can be introduced into a deeper aquifer by managed aquifer recharge or aquifer storage and recovery systems, such as injecting treated wastewater containing MP, or surface runoff or stream water containing MP (Re 2019). Li, Wang, et al. (2021) investigated the impacts of seawater intrusion and groundwater-seawater displacement on the transport behaviors of marine plastics and concluded that the seawater intrusion would transfer MP into coastal aquifers. The available studies seem to be able to quantify only the MP entering groundwater, while the fate of MP in groundwater remains limited (Boyle and Örmeci 2020, Gao et al. 2021).
Figure 2-4 provides a schematic representation of possible pathways for MP to enter and be transported through an aquifer.
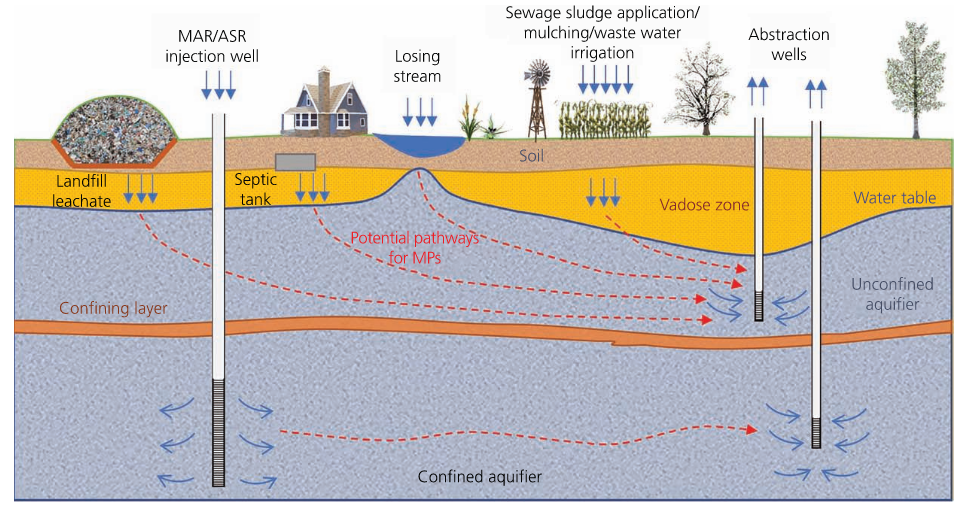
Figure 2-4. Schematic representation of MP transport pathways in an aquifer.
MAR (managed aquifer recharge), ASR (aquifer storage and recovery)
Source: O’Kelly et al. (2021).
Smaller particles preferentially migrate deeper in soil and groundwater. The wet-dry cycle and infiltration play an important role in the depth to which MP penetrate the subsurface (Gao et al. 2021, O’Connor et al. 2019). It also should be noted that underground anthropogenic activities may introduce MP in groundwater (for example, various types of well construction and groundwater investigation, etc.) when plastic material, such as PVC casings/screens, low-density polyethylene (LDPE) tubing, etc., is used.
2.3.4 MP in the Oceans
MP are present in oceans around the world. MP enter the oceans from our estuaries, rivers, industrial outfalls, and the atmosphere. On the ocean surface, gyres (the major ocean currents) move MP around the ocean, where they eventually move toward the slower moving centers (Figure 2-5). Depending on their buoyancy, MP may remain at the surface for many years.
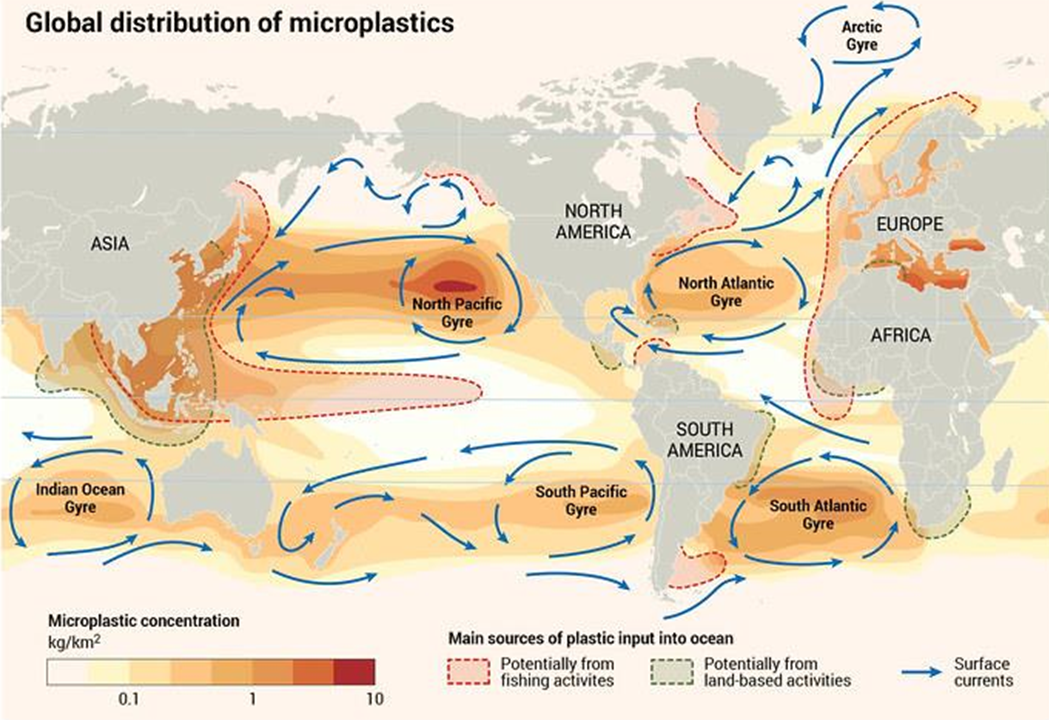
Figure 2-5. Global distribution of microplastics.
Source: Riccardo Pravettoni and Philippe Rekacewicz,
https://www.grida.no/resources/13339
Denser MP sink deep into the ocean and are distributed throughout the subsea by currents. MP have been found at every depth in the ocean where scientists have looked. The Monterey Bay Aquarium Research Institute reported MP throughout the deep pelagic water column with the highest concentrations present at depths between 200 m and 600 m (Choy et al. 2019).
There are many physical processes governing transport of floating plastic debris, such as ocean currents and convergence zones, Stokes drift, tides, wind force, Langmuir circulation, ice formation, melting and drift, etc. (van Sebille et al. 2020). Vertical transport is also possible due to degradation or aggregation with other denser particles (Fazey and Ryan 2016). Plastic particles less dense than seawater are transported throughout marine environments (Zarfl and Matthies 2010) and concentrated in the five great garbage patches in the Indian, Atlantic, and Pacific Oceans (Lebreton et al. 2018). Plastics on the ocean surface will break down through physical and biological processes to produce MP. The resulting MP exhibit positive, neutral, or negative buoyancy depending on the inherent physical properties (for example, density) of the plastic and changes in density due to aggregation or biological fouling (Cole et al. 2016, Kaiser, Kowalski, and Waniek 2017, Long et al. 2015, Van Cauwenberghe et al. 2013).
Transport of MP in deep marine environments is driven by three primary processes (Kane and Clare 2019):
- gravity-driven transport in sediment-laden flows
- biologically driven settling or transport of surface-floating or water column–suspended particles
- transport by thermohaline currents, including settling and reworking of deposited MP
Along the coastline, MP can be ejected into the atmosphere through convective updrafts when breaking waves cause bubbles of trapped air to rise to the surface and burst. The resulting void caused by the bursting bubble is quickly backfilled by the water causing a secondary ejection known as a jet to eject MP into the atmosphere (Allen et al. 2020). According to the 2020 article, an estimated 136,000 tons/year of MP could be ejected into the atmosphere from sea spray.
2.4 MP in Soil
Soil may represent the largest global reservoir for MP, although most MP research has been concentrated on the marine environment (Hurley and Nizzetto 2018). It is likely that soils will act as long-term sinks for MP given that most plastics are used and disposed of on land (Horton et al. 2017). Plastics are suggested as a stratigraphic indicator for the past hundred years due to their suspected omnipresence in soils (Zalasiewicz et al. 2016).
2.4.1 MP Distribution in Soil
MP spiral around the globe with distinct atmospheric, oceanic, cryospheric, and terrestrial residence times, and have been found in soils from urbanized cities to remote and isolated areas such as the Tibetan plateau (Allen et al. 2020, Brahney et al. 2021).
The abundance in soils depends on soil type and management, plastic size and density, and precipitation (Horton et al. 2017, Nizzetto, Futter, and Langaas 2016). The types and categories of MP in soils depend on land use, regions, and other factors. Lands close to busy roads and those used for waste management and agricultural areas, as well as home gardens, are found to exhibit high MP abundance (Horton et al. 2017, Huerta Lwanga et al. 2017). Results of the study in southeast Germany by Piehl et al. (2018) where soils from agricultural land receiving conventional agricultural treatment (no MP-containing fertilizers or agricultural plastics, such as greenhouses, mulch, silage films, biosolids, etc., were used) suggested that PE was the most common polymer type, followed by PS and PP. Films and fragments were the dominate MP categories (Piehl et al. 2018). Another study (Xu, Han, et al. 2022) conducted in China showed slightly different results regarding the shape and type distribution of MP in soil. PE and PP, followed by rayon and PET, comprised the majority of polymers in soil among 25 types detected, and film was the most abundant type compared to fragment, fiber, foam, and pellet. The categories of MP are expected to be different at nonconventional agricultural treatment farmland and the MP concentrations are expected to be higher. For example, the number of fibers may be higher in the soil where biosolids are applied as fertilizer.
The size distribution of MP in soil is affected by the various pathways in which they enter the environment. For example, fibers, mainly in the size range of 0.2 mm to 0.66 mm, are observed in urban and suburban regions during atmospheric deposition (Dris et al. 2016). The distribution of MP in soils also depends on soil depth. The study by Piehl et al. (2018) indicated that the plastics found in the upper 50 mm of the soil are commonly several orders of magnitude larger than MP (that is, greater than 5 mm in size), and the abundance of particles increases with decreasing size. This is likely due to progressive fragmentation of larger pieces into more and smaller pieces.
2.4.2 Sources of MP in Soil
Major sources contributing MP to soils include landfills, litter along roads and trails, illegal waste dumping, road runoff (for example, TWRP), WWTP by-products (for example, reclaimed water irrigation, biosolids applications, see Figure 2-6), agricultural products and processes (for example, mulch, fertilizer, soil conditioners, pesticides, seeds, planting aids, direct use of plastic sheets, etc.), dredged or remediated sediments (Pathan et al. 2020, Wiesmayer 2021), and atmospheric deposition (Brahney et al. 2021). In addition, intentionally added MP are commonly used in both agriculture and horticulture, mainly from the nutrient prills (for example, polymer-coated fertilizers) for controlled-release fertilization (GESAMP 2015).
It was estimated that between 125 and 850 tons of MP per million inhabitants are added annually to European agricultural soils through direct application of biosolids; this includes a total yearly input to farmlands of 63,000–430,000 tons of MP in Europe and 44,000–300,000 tons of MP in North America (Nizzetto, Futter, and Langaas 2016). The number of MP (for example, synthetic fibers) entering the terrestrial environment has been growing and is expected to continue to increase (Gavigan et al. 2020).
Direct use of MP-containing materials is another pathway for MP into soil, such as the application of biosolids generated from a WWTP. For example, as textiles are washed, fibers can be broken and the small pieces (MP) are entrained into the wastewater that is discharged to the local WWTP. The MP (microfibers) are accumulated in the biosolids after the treatment process. The biosolids are then partially dried and then can be applied to agricultural fields as fertilizer (Brahney et al. 2021, Kapp and Miller 2020, Lant et al. 2022). It was noted that synthetic/cotton blends actually produce the largest quantities of MP (such as PE/cotton), when compared to the synthetic material alone (Zambrano et al. 2019). It was estimated that approximately 16%–38% of the heavier-than-water MP contained in the biosolids were added to and stored in soils (for example, through routine applications of sewage biosolids) based on a mathematical model of catchment hydrology, soil erosion, and sediment budgets (Nizzetto et al. 2016). MP have also been intentionally added to agricultural products to control the release of fertilizers or increase the water-retaining capacity of soils. Recent scientific studies show that agricultural soils could hold more MP than the ocean basins, potentially making agricultural lands some of the most plastic-impacted places outside of landfills and urban spaces (Pukclai 2020).
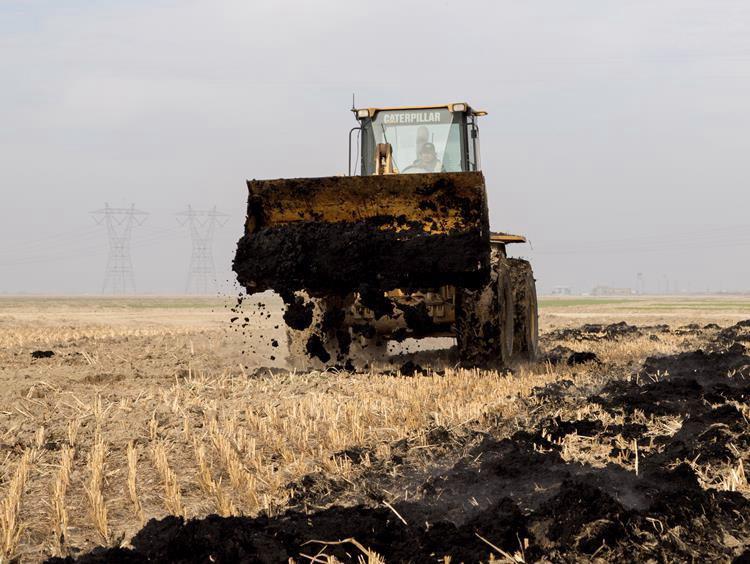
Figure 2-6. Biosolids being applied to an agricultural field.
Source: City of Los Angeles Environment and Sanitation.
Fragmentation of intentionally or unintentionally discarded plastic debris is one of the major input routes (Bläsing and Amelung 2018, de Souza Machado, Kloas, et al. 2018, Horton et al. 2017, Hurley and Nizzetto 2018, Piehl et al. 2018). During this process, partially trapped MP at the soil surface are directly exposed to UV light and broken down through photodegradation, which is recognized as a major process for decomposition of polymer materials (Singh and Sharma 2008, Williams and Simmons 1996). For those already broken down, further mechanical disintegration caused by application of shearing forces can occur through other mechanisms depending on site-specific locations, such as freeze-thaw cycles, pressure due to burial under soil or snow, or damage caused by interactions with organisms (Lambert, Sinclair, and Boxall 2014, Rillig 2012). In farmland, shearing forces can be ploughing and tillage work (Piehl et al. 2018). It is worth noting that the study by Weber, Santowski, and Chifflard (2022) on the agricultural fields after sewage biosolids application concluded that anthropogenic ploughing was mainly responsible for plastic spreading, as opposed to natural transport processes such as erosion, although most MP remained spatially stable over long periods of time and only some were physically transported.
2.4.3. Fate and Transport of MP in Soil
The fate and transport mechanisms of MP to and through soil are not well understood (Dris et al. 2016). Available studies suggest that the fate of MP in soils is complex, and many factors play a role, such as the type of MP (that is, polymers vs. others), density (affecting the wind action transport pathway and movement potential), size, color, shape, soil conditions (for example, pH, mineral content, organic matter, etc.), weather conditions (that is, greater wet-dry cycles increase the migration depth), etc. (Boyle and Örmeci 2020, Horton et al. 2017, Huerta Lwanga et al. 2017, O’Connor et al. 2019). Several pathways were documented for larger plastic debris entering terrestrial soils and later becoming MP (Bläsing and Amelung 2018, Brahney et al. 2021, Horton et al. 2017, Huerta Lwanga et al. 2017, Hurley and Nizzetto 2018, Piehl et al. 2018, Rillig, Ziersch, and Hempel 2017).
Wind erosion and transport constitutes another distribution route for small plastics and MP from their original source to remote areas where deposition to soils (due to rain, declining wind, or barriers) could occur (Dehghani, Moore, and Akhbarizadeh 2017, Dris et al. 2017). Particle motion during the erosion and transport process includes pushing or rolling over the surface, also known as “surface creep” (Piehl et al. 2018).
Previous studies also demonstrated that MP could be transported along the soil profile by earthworms and via preferential flow paths (Huerta Lwanga et al. 2017, Rillig, Ziersch, and Hempel 2017). The lower soil could be hydraulically connected to the upper soil, particularly in clayey soils that tend to shrink while drying (Bogner et al. 2013). MP can travel downward, reaching groundwater, especially when the groundwater table is shallow. Once they encounter the saturated soils, the MP can flow through preferential pathways to other receptors (Piehl et al. 2018).
2.4.4 Impact of MP on Soil Matrix
Studies have documented that MP induce impacts on soil matrices, depending on their shape (for example, particles, films, fibers), concentrations, or properties (that is, chemical composition, dimensions). MP may alter biological, chemical, and physical properties of soils (Pathan et al. 2020). The interactions between MP in soils and soil microbiota, fauna, and vegetation may further disrupt the biophysical environment of farmland soil, potentially leading to economic losses and to their entrance into the trophic food change, affecting human feeding and health (Pérez-Reverón et al. 2022).
Once MP enter soils, the abundance, distribution, and physio-chemical properties of MP may change via various mechanisms. MP may cycle through a new media or cycle back to the source media. MP may cycle from soils back to surface water bodies through erosion and stormwater transport, or back to the atmosphere then to surface water bodies or the ocean through aerial deposition, or migrate vertically into groundwater, or further degrade. MP have the potential to alter soil properties and processes, such as bulk density and water retention capacity (de Souza Machado, Lau, et al. 2018). MP films accelerate evaporation, decrease water content, and reduce the soil tensile strength and bulk density while increasing soil porosity.
Lehmann et al. (2021) examined the effects of introduced MP of varous shapes and composition on soil structure. MP fibers have a distinct negative impact on soil dissimilarity compared to foams, films, or particles. Polyester microfibers and foams can cause negative effects on soil aggregate stability, new aggregate formation, and concentrations of larger aggregates, while MP beads and particles may cause a range of positive to negative effects (Boots, Russell, and Green 2019, de Souza Machado, Kloas, et al. 2018, de Souza Machado et al. 2019, Lehmann et al. 2021, Liang et al. 2019, Zhang, Chen, et al. 2019). Microfibers can introduce fracture points after becoming a part of newly formed aggregates, likely facilitating breakdown when encountering external force. The effect is also related to the concentration and dimensions of microfibers (de Souza Machado, Kloas, et al. 2018, Lehmann et al. 2021). Particles are less well incorporated into aggregates compared to fibers, likely due to size difference and other properties, such as surface roughness, irregularity, rigidity, and brittleness (Lehmann et al. 2021). The 2021 study by Lehmann et al. also indicated that MP films negatively affect aggregate formation, but positively affect aggregate stability. The size of films likely plays a role in the stability effect (Lehmann et al. 2021).
MP may become a part of soil aggregates after entering the pore networks and may control soil processes, such as biogeochemical cycles, soil carbon storage, and processing (Rabot et al. 2018). Also, diverse types of MP (with different chemical properties), due to their potential toxicity (that is, additives leaching and migration), can affect soil microbial activity, subsequently affecting soil aggregation because microbial metabolites can function as a gluing substance and promote soil stability (Caesar-Tonthat 2002).
The addition of plastic granules can increase the total organic carbon content of soil (Rillig 2018). Also, MP films and particles can decrease the decomposition of organic matter in soil; this effect is more detectable for casted PP, PE films, and PP particles compared to other types (PET films, PC particles, etc.) and shapes (foams and fibers) studied (Lehmann et al. 2021). This effect is likely due to the change of soil physical parameters (that is, porosity, connectivity, aeration) and sorption and migration of chemicals and additives, resulting in microbial activity changes, and subsequently changes the mineralization rate of soil organic matter (Lehmann et al. 2021, Zhang, Zhang, and Li 2019). Addition of MP in soil can negatively affect the nutrient availability by increasing the rate of dissolved organic matter decomposition in soil, therefore decreasing the dissolved organic carbon, nitrogen, and phosphorus in soils (Liu et al. 2017).
2.5 MP in Sediment
MP have been detected in marine and freshwater sediments and in both flowing and nonflowing systems. The primary source of MP in sediment is the settling out of suspended MP in the water column. MP characteristics (density, diameter, and shape), wind, tides, biofouling, and weathering influence particle settling (Darabi et al. 2021). Fibers and fragments are frequently detected MP in sediments, and higher density MP are more likely to be trapped and settle in sediment (Darabi et al. 2021, Falahudin et al. 2020). MP are more likely to settle in surficial sediments, and MP abundance decreases with sediment depth. Recent modeling indicates that residence times are highest in river headwaters and can be years under low-flow conditions (Drummond et al. 2022). MP in river sediments are often unaccounted for and are likely a pollution legacy that is crucial to include in future global assessments (Drummond et al. 2022).
A study by Falahudin et al. (2020) found that MP were more concentrated in clay as opposed to sand-dominated sediments. This study also assessed the importance of total organic carbon (TOC) impact on the transportation of MP and suggested that sediments with higher TOC content are more likely to have a higher abundance of MP. Maes et al. (2017) found a correlation between abundance of MP with decreased sediment particle size. However, a study by Vermaire et al. (2017) found that the concentration of MP recovered in sediment samples was not significantly related to sediment particle size or TOC content.
MP in sediment can be resuspended and transported through surface water flow to downgradient areas. Thus, rivers are considered a key pathway for transporting MP to different areas (Darabi et al. 2021), particularly to coastal areas (Kane and Clare 2019). In ocean systems, MP can be transported and deposited by turbidity currents (Darabi et al. 2021, Pohl et al. 2020). MP entrained in the flow are transported along the bed, or in suspension (Darabi et al. 2021), and deposited (redistributed) downstream. The depositional process is in part governed by size and density of the plastic (Sutton et al. 2016).
2.6 MP in Air
The atmosphere plays an important role in MP transport, with increased occurrence and higher transport concentrations noted in more densely populated areas (Petersen and Hubbart 2021, Zhang, Kang, et al. 2020). This increase is attributable to greater anthropogenic activity, industrialization, and human population density. Atmospheric deposition of MP may be driven by precipitation events, including both rain and snow (Allen et al. 2019, Dris et al. 2016). Currently, due to their inhalation and combination with other pollutants (for example, mercury, polycyclic aromatic hydrocarbons), MP are considered an emergent component of air pollution (Barboza et al. 2018, Gasperi et al. 2018, Liu, Li, et al. 2019, Rochman et al. 2019, Tourinho et al. 2019, Wright and Kelly 2017).
Airborne and atmospheric transport of MP was first reported in Paris during 2015 (Dris et al. 2015). Atmospheric transport includes numerous processes (for example, wind speed, up/down drafts, convection lift, and turbulence) that are all considered important vectors affecting MP transport. The vectors further influence the flux mechanism and source-sink dynamics of plastic pollution in both marine and terrestrial environments (Bank and Hansson 2019, Liu, Wang, et al. 2019, Zhang, Gao, et al. 2019). While investigating MP contamination in urban settings, Dris et al. (2015) concluded that atmospheric fallout could be a significant source of fibers in freshwater ecosystems. MP have also been detected in the atmosphere in pristine remote areas far away from source regions, suggesting potential long-distance atmospheric transportation. Recent studies reaffirm that atmospheric MP transport constitutes a major pathway for MP to remote regions (Bank and Hansson 2019, Evangeliou et al. 2020). The Brahney et al. (2021) atmospheric transport model revealed that MP deposition to the terrestrial environment over the western United States came approximately 84% from roads, 11% from sea spray, and 5% from agricultural soil dust. In addition, approximately 0.4% of MP carried by dust in urban areas resulted from road traffic (for example, TWP) and litter breaking apart (Brahney et al. 2021).
Various shapes, including fiber, fragment, and film, have been detected in the atmosphere (Abbasi et al. 2019, Allen et al. 2019, Bergmann et al. 2019, Dehghani, Moore, and Akhbarizadeh 2017, Klein and Fischer 2019). Fibers and fragments appear to be the dominant shapes. Fibers, for example, are the dominant shape found in urban atmospheric deposition and are likely closely connected to the increasing production of synthetic fibers for clothing, upholstery, carpet, etc., while fragmented MP could possibly result from the exposure of larger plastic items to strain, fatigue, or UV degradation (Liu, Wang, et al. 2019). However, identifying the difference between fibers and fragments for smaller MP may be difficult due to their size (Zhang, Kang, et al. 2020). MP have also been detected in indoor air due to sources like building materials and consumer goods, with fiber being the predominant shape of MP in most indoor dust samples (Zhu et al. 2022).
The predominant size of atmospheric MP is near the smaller end of the scale, where fibers and fragments have been investigated. In pristine, remote locations, the predominant length of plastic fibers was less than 300 µm with a greater proportion of fragments sized less than 50 µm. In urban locations, fiber lengths were predominantly between 200 µm and 5,000 µm, whereas most fragments were less than 63 µm (in the longest direction). The amount of MP particles decreases with increasing size; particle size is an important aspect of atmospheric analysis and research because it affects their deposition (Bergmann et al. 2019, Isobe et al. 2015).
To date, there is no clear correlation or explanation for the variability or composition of polymer types in atmospheric samples. The variety of polymer types found in atmospheric samples published to date does not indicate a clear or obvious delineation between lighter and denser polymer types (Zhang, Kang, et al. 2020).
2.7 MP in Urban Litter
Studies as early as 2008 (DOEE 2008) have shown that a significant amount of urban litter is plastics. San Francisco Bay Area monitoring studies conducted on behalf of the Bay Area Stormwater Management Agencies Association (BASMAA) have characterized urban litter, including macroplastic items that will break down into MP in the environment. Over 150 storm drain trash capture devices were monitored between 2010 and 2011 (EOA 2014). Trash and debris were intercepted, collected, and characterized three to four times at each inlet. Overall, plastic items made up between 2.2% and 15.1% by volume (0.3%–3.0% by weight) of the material captured during the four storm events. Miscellaneous trash, which includes cigarette butts (a source of MP) and items made of rubber, fabric, or other hybrid materials, comprised 0.1%–4.8% by volume (0.9%–1.5% by weight) during the same four events. These values can change dramatically based on geography. A 2021 study (Youngblood, Finder, and Jambeck 2021) reported that 74% of the litter, by count, in the Mississippi River basin is plastic.
Storm events likely play a major role in mobilizing macroplastics and MP derived from litter. A Southern California study evaluating inputs from the Los Angeles River drainage to the coastal ocean near Long Beach found that concentrations of MP increased sevenfold following a storm, from 8 pieces/m3 to 56 pieces/m3 (Moore, Lattin, and Zellers 2005). Discharge of MP to San Francisco Bay via the Sacramento-San Joaquin River delta has not yet been evaluated; however, studies of its tributaries and watersheds indicate that stormwater plays a major role in transport of MP to the bay (Sutton et al. 2019). Studies of tributaries to Chesapeake Bay and the Great Lakes suggest that they can be a significant pathway for MP pollution (Baldwin, Corsi, and Mason 2016, Moore, Lattin, and Zellers 2005, Yonkos et al. 2014). Surface waters of four tributaries to Chesapeake Bay (Appendix A.2) were monitored for MP monthly between July and December to assess relative loads and the influence of storms on the loads (Yonkos et al. 2014). All but one of the samples collected contained MP, ranging in concentration from less than 1 to greater than 560 g/km2. The highest concentrations were associated with heavily urbanized areas after storm events (Yonkos et al. 2014). A study of 29 Great Lakes tributaries, each sampled three or four times, found that 98% of plastic particles were MP (Baldwin, Corsi, and Mason 2016). Fragments, films, foams, and pellets were found at higher levels in tributaries draining urban watersheds, and during conditions leading to runoff, such as rainfall or snowmelt. Interestingly, fibers, the most frequently detected particle type, were not associated with urban areas, wastewater discharges, or runoff (Baldwin, Corsi, and Mason 2016).
2.8 Prevalence of MP in Biota
MP have been found in terrestrial and marine biota, including plants, invertebrates, birds, mammals, and fish, spanning all levels of the food web. It is important to note that there are still conflicting views on the ability of MP to bioaccumulate and biomagnify in organisms. For example, some studies have found that bioaccumulation is clearly taking place among trophic levels (Miller, Hamann, and Kroon 2020), while others suggest that although it is clear that MP are being ingested, there is no clear data proving they are bioaccumulating or biomagnifying (Gouin 2020). Additional discussion of trophic transfer can be found in Section 4.4.
Studies have shown that plants do uptake MP (Petersen and Hubbart 2021). In a study of crop plants, MP were found to be taken up by roots and then transported to the shoots (Li, Luo, et al. 2020). MP can also be transported to the fruit and have been detected in tomatoes (Hernández-Arenas et al. 2021). Earthworms can transport and disperse MP in soils through the external attachment of the plastic particles to the animals or by ingestion and subsequent egestion (Allen et al. 2022, Petersen and Hubbart 2021). However, transport and movement rates of soil MP are poorly documented and factors influencing these rates remain largely unknown (Allen et al. 2022, Petersen and Hubbart 2021). MP can also be consumed by soil invertebrates, and MP can accumulate in the digestive tract of soil organisms (Petersen and Hubbart 2021).
Cera and Scalici (2021) recently reviewed the available literature evaluating MP in freshwater biota. A total of 62 publications were identified evaluating MP in biota worldwide. Figure 2-7 illustrates the frequency of studies according to taxa (more information about biota sampling can be found in Sections 3.4.4 and 3.6.4.
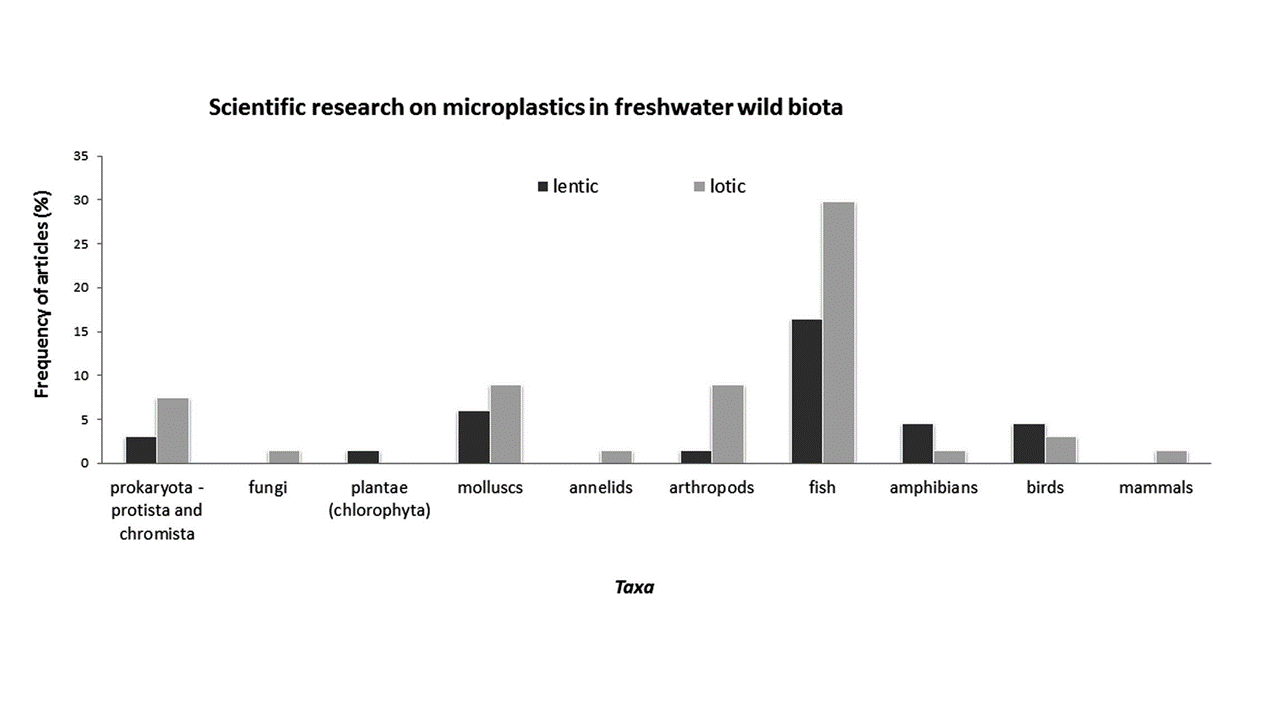
Figure 2-7. Number of studies on microplastics in freshwater biota.
Source: Cera and Scalici (2021).
2.9 Degradation
Plastics are subjected to abiotic and biotic degradation processes involving chemical, physical, and biological reactions in the environment, which result in the formation of secondary MP. Many advanced technologies have been developed to characterize the degradation of plastics. Light induces the photodegradation of polymers and is additionally linked to the chemical reactions that take place due to the carbonyl groups absorbing the light’s UV radiation.
Degradation causes oxidation and chain scission of plastic polymers, forming low molecular weight degradation products and ultimately causing changes in physicochemical and mechanical properties of the MP (Gewert, Plassmann, and MacLeod 2015). Photoaging can have significant effects on the properties of MP, leading to changes in their interaction with the surrounding environment. By changing their size, structure, and density, there is a wider distribution net, allowing MP to spread to every corner of the earth (Cheng et al. 2022).
2.9.1 Abiotic Degradation
Thermal degradation refers to the breakdown of plastics due to energy input stemming from elevated temperature. Plastics can undergo thermo-oxidative reactions at high temperature. When sufficient heat is absorbed by the polymer to overcome the energy barrier, the long polymer chains can be broken, generating radicals (Petersen and Hubbart 2021, Pirsaheb, Hossini, and Makhdoumi 2020). These radicals can react with plastic, resulting in further breakdown or chemical change.
Mechanical degradation refers to the breakdown of plastics due to the action of external forces. In the environment, external forces can come from the collision and abrasion of plastics with rocks and sands caused by wind and waves. Freezing and thawing of plastics in aquatic environments can also result in the mechanical degradation of polymers (Niaounakis 2015). Farming practices (for example, plowing fields, physically moving/removing plastic barriers) can generate MP from existing products. The effect of the external forces depends on the mechanical properties of the plastics.
In air, one study showed photodegradation of plastics resulted in changes in appearance and texture, a decrease in mechanical properties, and alteration of physicochemical properties (Ojeda et al. 2011). Plastics in air sheltered from UV also showed color changes during exposure, and visible light and nitrogen dioxide (NO2) were found to be the most important variables related to the degradation, followed by ozone.
2.9.2 Biotic Degradation
Although many plastics are typically resistant to biodegradation, some organisms (for example, bacteria, mealworms) in soils have the ability to degrade specific polymers (Gu 2003, Yang, Yang, et al. 2015). For example, while photodegradation is mainly responsible for the initial degradation of plastics floating on the surface of seawater, biodegradation may take over once the plastic surface is covered with biofilm (Zhang, Hamidian, et al. 2021). Biological degradation can occur through physical breakdown of the plastics by organisms, such as by biting, chewing, or digestive fragmentation (Cadée 2002, Cau et al. 2020, Dawson et al. 2018, Jang et al. 2018, Mateos-Cárdenas et al. 2020, Porter, Smith, and Lewis 2019) or by biochemical processes (Danso et al. 2019). Microorganisms, including bacteria, fungi, and insects, contribute to the biological degradation of plastics (Crawford and Quinn 2017). Plastics may be very persistent on the seafloor and in marine sediment due to low temperatures and dissolved oxygen concentrations resulting in slow biodegradation processes, as well as protection from ultraviolet radiation.
3 Sampling and analysis
Although MP in the environment have been a concern for many years, techniques and best practices for sample collection and analysis of these particles and fibers are still very much evolving. To date, few standard methods have been adopted, and currently there are no regulations governing levels of MP, although there are draft requirements for testing and reporting MP in drinking water in California.
- In 2020, ASTM International (ASTM) adopted two standards: one for water sample collection (ASTM 2020a), and the other for water sample preparation (ASTM 2020b), which covers low, medium, and high ranges of suspended solids.
- California State Water Board adopted Raman and FTIR methods for MP identification in drinking water (CA SWRCB 2021b, a).
Select a red dot in Figure 3-1 to find out more about sampling methods in various environmental media.
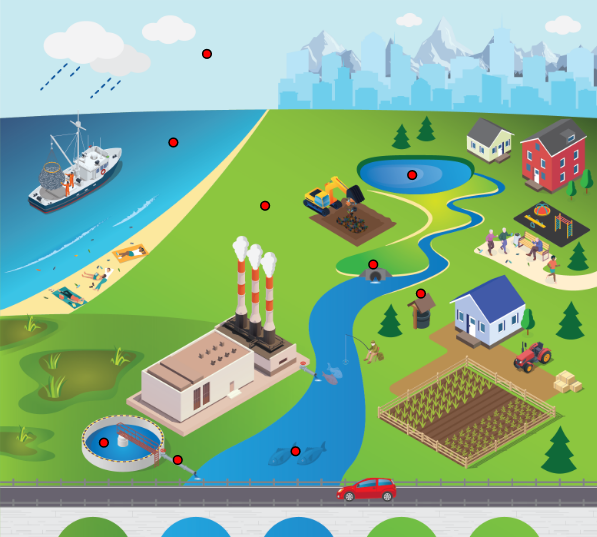
Groundwater/Drinking Water
Section 3.4.1.1-sample collection
Section 3.6.1.1-sample preparation
Drinking Water
Section 3.4.1.5-sample collection
Section 3.6.1.1-sample preparation
Surface Water - Freshwater
Section 3.4.1.2.1-sample collection
Section 3.6.1.2-sample preparation
Sediment
Section 3.4.2.2-sample collection
Section 3.6.2-sample preparation
Pore Water
Section 3.4.2.3 sample collection
Section 3.6.1.2-sample preparation
Figure 3-1. Conceptual model for sampling methods.
Source: Jonathan McDonald and the ITRC MP team.
It is the goal of this section to outline the most common techniques and best practices for sampling and analyzing MP (Figure 3-2); however, this section is not intended to represent technical standard operating procedures (SOPs). References included and future documents may detail SOPs and procedures. Nanoplastics (NP) will be referenced as appropriate because many of the same techniques apply, but details specifically regarding NP may need to be included in a separate document. Although many compounds and chemicals are known to adsorb to MP, this section will not address them because the techniques are more appropriately covered in established techniques specific to those compounds and chemicals.
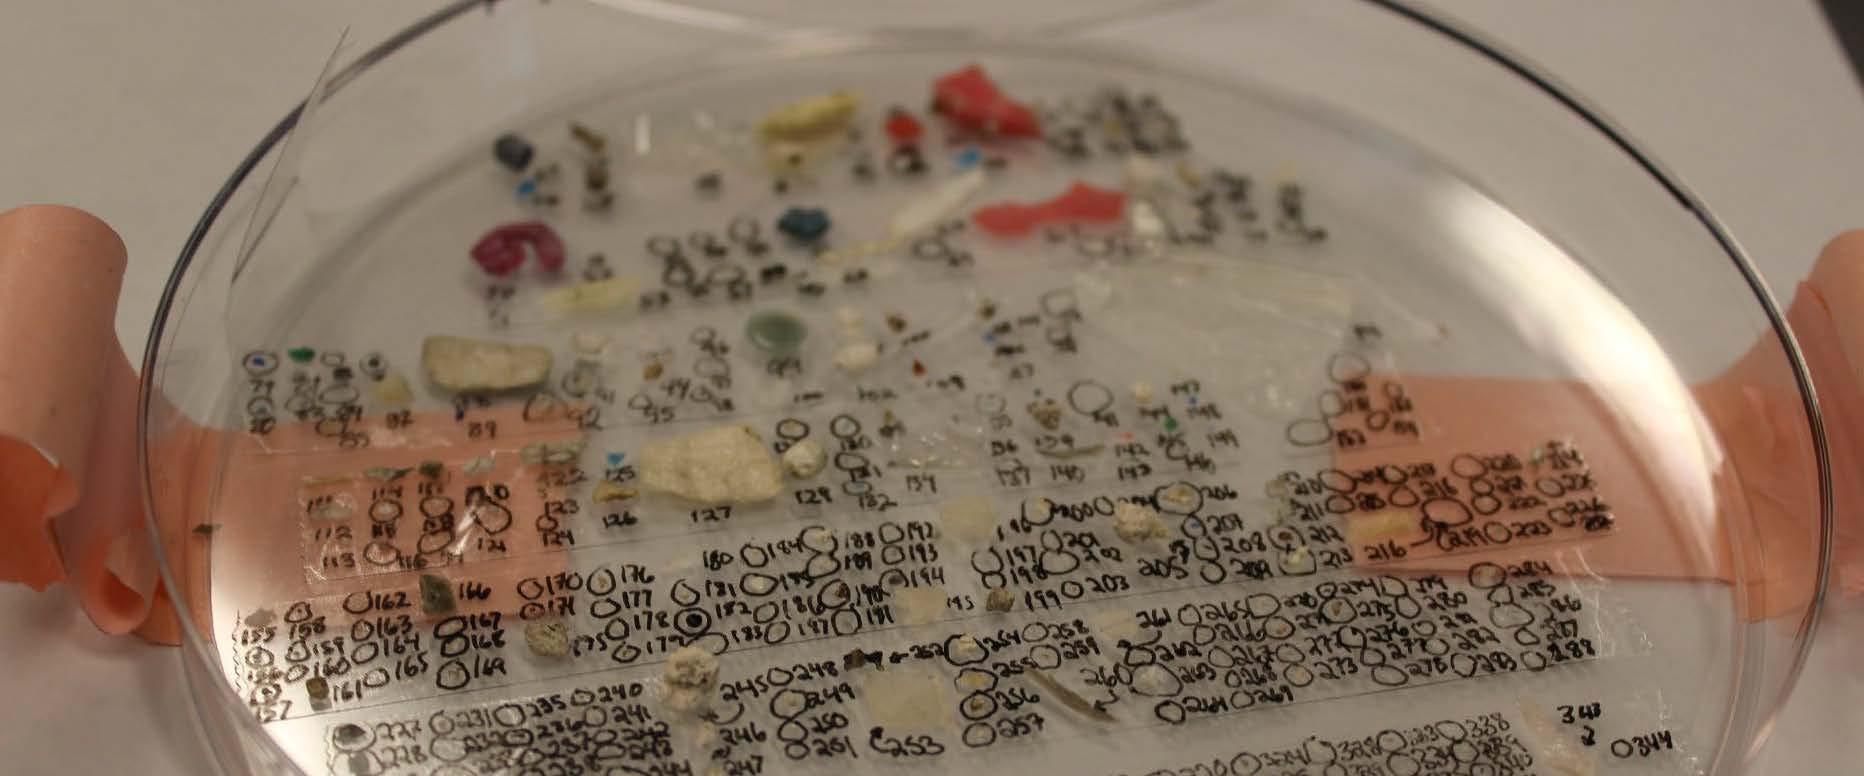
Figure 3-2. Example of a subset of microplastics collected from a single experiment. The large end of the MP scale is visible to the naked eye.
Source: Rochman Lab via the California Ocean Protection Council.
3.1 Sample Collection Considerations—MP
3.1.1 General Sampling Considerations
Study questions for monitoring purposes should be identified, and the methods chosen should be compatible with study objectives. Publications on appropriate study data quality objectives (DQOs) exist (USEPA 2006). DQOs could include:
- identification and determination of mass of MP
- identification of particle number, size, and shape of MP
- characterization of specific properties of individual MP particles
- polymer type
For general monitoring, targeted size ranges should be defined by programmatic needs, understanding that the smaller sizes are more difficult to sample, extract, and identify.
3.1.2 Filtration
Sieve and filter sizes should be chosen in accordance with DQOs appropriate for the experimental design. For example, if the experimental design is to collect particles that may be ingested by filter-feeding organisms with uptake between 50 and 100 µm, a series of sieves and filters that removes particles greater than 150 µm and captures particles greater than 40 µm may be appropriate. Also consider that the smaller the sieve or filter size, the more rapidly it clogs; therefore, there may be a need to balance the sieve size with the volume that is filtered, or to plan for multiple filters from one sample.
3.1.3 Volume
Several factors need to be considered when determining desired sample volume: matrix; if water, the type of water (tap, river, lake, groundwater, etc.); location (rural versus urban); and expected general concentration of MP particles and other particles that may clog filters. A sample volume that is too large can result in the collection of too many particles, which can clog filters and sieves. Sample volumes that are too small reduce the chances of detecting particles and can result in loss of statistical power (Koelmans et al. 2019). ASTM publications include volume considerations for high, medium, or low concentrations of suspended solids and have been validated for the collection of samples from drinking water, surface waters, wastewater influent and effluent (secondary and tertiary), and marine waters (ASTM 2020b). Analytical subsample volumes will be discussed in the appropriate analytical sections.
3.2 General Quality Assurance/Quality Control
Quality assurance and quality control (QA/QC) are particularly important considerations for MP research and analyses because the likelihood of contamination, including cross-contamination, is high. This high potential for contamination results from the ubiquitous presence of plastics and MP introduced through a variety of products, materials, and sources (Gwinnett and Miller 2021). The potential contamination can be appropriately addressed through special considerations for collection and processing of samples, as described in Section 3.2.2.
General good laboratory practices, such as the maintenance of a clean lab bench and equipment, initial and ongoing staff training, proper chain of custody of samples, frequent instrument calibration, etc., are all foundational aspects to reliable MP analysis. Sample bottles should be rinsed with reagent water prior to sampling. Plastic sampling materials should be avoided where possible (Koelmans et al. 2019). Because of the inherent use of plastics in our daily lives, results from studies without explicit QA/QC planning are likely to not be useful due to contamination of samples and equipment. Though a standardized method does not yet exist, a highly cited MPs reporting guidelines checklist has been published in Cowger et al. (2020).
3.2.1 Collection of and Processing of Blanks
One of the most important and valuable steps to track and minimize contamination is the use of blanks in sample collection and processing. Blanks are samples that undergo all manipulations and contain all reagents experienced by a typical sample but contain no sample matrix. They are designed to determine whether contamination of a sample occurs during processing in either the field or lab. During collection, field blanks should be taken at each site or during each day of collection at a minimum. Field blanks consist of an empty or reagent water (Milli-Q or filtered DI)-filled sampling container that follows the same collection procedures as samples and can be used to document the contribution of contaminating materials to overall counts. Laboratory blanks should be employed during sample processing by subjecting reagent water or a clean or known reference material to the same processing steps as the rest of the samples. For both field and laboratory air blanks, the blank sample is opened when the sample is exposed to the air and closed when the sample is not exposed to the air. During processing, laboratory blanks should be used for every 10–20 samples being processed at one time, at a minimum. Additional blanks to track general laboratory contamination can be made by placing wetted filters in glass petri dishes or empty or reagent water-filled glass beakers on common laboratory surfaces.
There are several options to process the contaminating particles from blanks, but no standard approach (Brander et al. 2020, Bråte et al. 2018, Miller et al. 2021) Blank results should be reported separately from sample results. Subtraction of blank results may be performed, but this is not always straightforward, as blank particles do not always match sample particles (Baechler et al. 2020, Harris et al. 2022). If particles found on blanks match those in a sample, they can be subtracted from samples processed during the same batch by their shape and color. For example, if four blue fibers are found in the blank, a maximum four blue fibers are then subtracted from all samples processed in that batch. Alternatively, particle counts from blanks can be provided in study information and any samples that contain counts lower than those found in blanks should be considered “non-detects.” Regardless of whether researchers choose to blank subtract samples, field and method blank data should be explicitly reported so that blank contamination may be tracked. Data validation approaches for interpreting blank results and qualifying data based on blanks should be determined prior to sampling and documented in the work plan (USEPA 2006).
For water samples, the sensitivity and limit of detection will be affected by the volume of water sample collected or filtered. The specific sample preparation options and analysis techniques also affect the overall sensitivity. Matching the sensitivity of the measurement process to what is necessary for decision-making rather than automatically selecting the most sensitive option in all instances is generally recommended.
3.2.2 Special Considerations for Collection and Processing Samples
Several considerations should be addressed when analyzing for MP. Though a standardized method does not yet exist, a highly cited MP reporting guidelines checklist has been published and is available in Cowger et al. (2020).
3.2.2.1 Clothing
Fibers shed from clothing can be a significant source of MP and contribute to sample contamination (Scopetani et al. 2020). Staff conducting sampling, processing, and analysis for MP studies should avoid clothing made from synthetic textile materials (for example, polyester, acrylic, spandex, etc.) in favor of natural materials such as cotton, hemp, and wool. Clothing policies may also require a specific color of clothing or lab coats to better track and deal with sources of contaminating fibers. In the laboratory, cotton lab coats will help to reduce plastic fiber emission from any semisynthetic or synthetic clothes and minimize high blank values. Nitrile or latex gloves are also recommended for laboratory processing, although care should be taken to replace gloves frequently and make note of gloves that degrade and shed. If contamination is significant, additional steps can be taken, such as the use of a lint roller to capture shedding fibers, or the use of sticky tape or a sticky mat in the laboratory entrances and exits to minimize MP or fiber travel (Brander et al. 2020).
3.2.2.2 Air Handling Systems
To minimize the transport and contribution of contaminating fibers throughout the laboratory, air circulation should be controlled as much as possible. Laboratories should ideally be outfitted or retrofitted with air handling systems with HEPA (high-efficiency particulate absorbing) air filters to reduce the transport and deposition of fibers onto laboratory surfaces. However, studies have also shown that the simple use of a fume hood when processing samples for MP analyses can minimize contamination by as much as 50%, while the use of a clean hood or laminar flow hood can reduce contamination by up to 97% (Wesch et al. 2017).
3.2.2.3 Filtration of Liquid Reagents, Including Processing Water
All processing water and reagents used for sample processing should be tested for contamination or directly filtered and kept in clean storage containers. Glass fiber filters are helpful for filtering bulk solutions as they do not clog easily and do not contribute to sample contamination. However, other filter types, such as cellulose or filters that do not interfere with analytical measurements, may also be used. Solutions should generally be filtered using 0.45 µm or 1 µm filter pore sizes. Larger pore sizes may be used provided they are smaller than the MP particle size thresholds proposed for use in the study.
3.2.2.4 Equipment and Supplies
Avoid the use of equipment and supplies made of plastic materials to collect, process, and analyze samples for MP. For example, samples should be collected into glass containers, using metal piping when possible, and processed using glass and metal equipment and supplies. If DQO include biological hazards, autoclaving of glass equipment can be performed to prevent contamination. When this is not possible, researchers should consider collecting portions of the supplies used, such as plastic tubing or plastic containers, and archiving them for possible confirmatory analysis in the event these materials appear to result in unforeseen contamination.
All sampling and processing supplies and equipment should be washed well with laboratory detergent and hot water, followed by triple rinses with reagent-grade water. Glassware that has been used for extensive processing may also be baked at high temperature to off-gas any remaining plastic residues. Glassware and other supplies should be kept in closed cabinets or upside down when not in use and should be covered by aluminum foil during sample processing.
3.2.2.5 Other Considerations
Special consideration should be taken for any materials in the laboratory or field that may contribute to contamination, such as the fibers from office chairs, old or disintegrating lab supplies or tubing, microscope covers, etc. Care should be taken to avoid or document the use of cleaning supplies used, such as wipes or terry towels, as these may leave fibers on surfaces that may interfere with analysis. Several considerations taken into account when designing and maintaining a laboratory for the analysis of MP are shown in Figure 3-3.
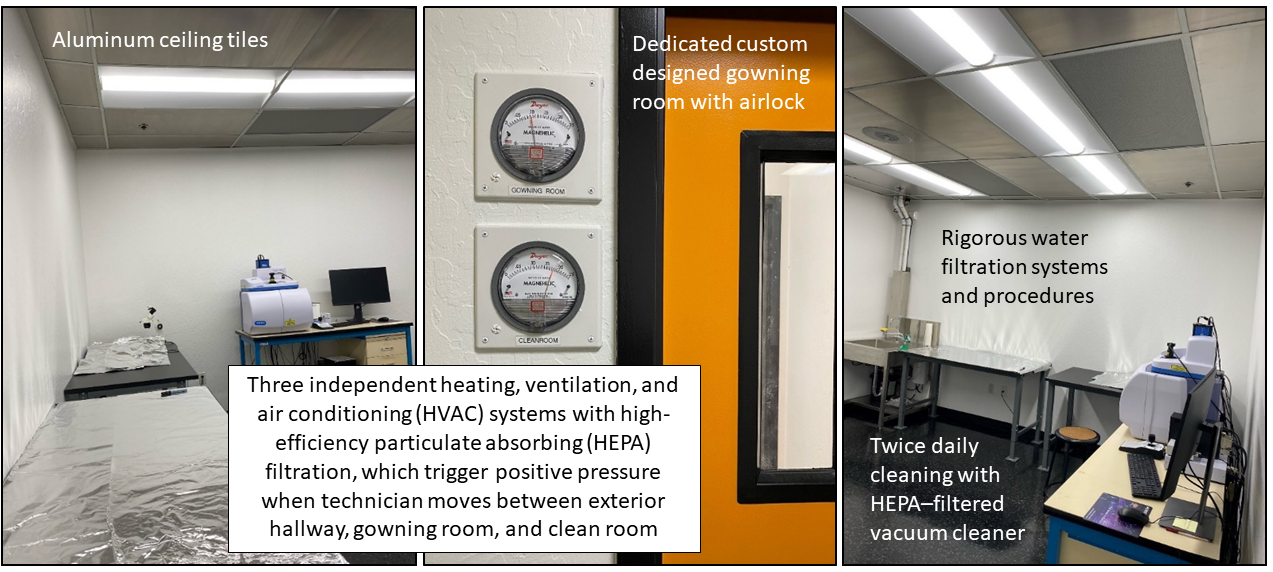
Figure 3-3. Considerations for laboratories analyzing for microplastics in samples.
Source: Eurofins Environment Testing
3.2.3 Standardization/Consistency
A universally standardized method of reporting results of MP laboratory analyses does not currently exist. This is partially due to the emerging nature of the MP pollution field but also due to the wide range of physical and chemical impacts that MP can have, which result in varying reporting goals. MP can be quantified in mass or count, depending upon project goals. It is recommended that sufficient information be provided in reports so that conversion to other commonly used units can be performed. Though a standardized method does not yet exist, a highly cited MP reporting guidelines checklist has been published and is available in Cowger et al. (2020).
3.2.3.1 MP Concentration Units
Miller et al. (2021) recommended providing particle counts rather than, or in addition to, total mass. It is yet unknown how particle shape and size affect toxicity. Current analytical methods generally lend themselves to counts, and this is the form in which most of MP data currently exist. Particle counts allow descriptors of shape and size, which more easily allow calculation of concentrations of specific types of particles, and are therefore easier to link to toxicity studies (Miller et al. 2021). When possible, report the actual size of particles rather than binning particles into size classes, as this allows for conversion to a hypothetical polydisperse mixture for modeling purposes (Koelmans et al. 2020). Reporting the actual size of the particles decreases the uncertainty in modeling sizes within binned classes for risk assessment.
Conversely, one advantage of using mass per volume (for example, µg/L for water) or mass per unit dry weight (for example, mg/kg for solids) for reporting is that these concentration units are commonly used for other contaminants in regulatory, monitoring, and toxicological programs (possibly except for engineered nanoparticles). As the most common unit of measure for contaminants, it would be useful to be able to consider MP in the same context. Volume and mass of sediment or soil samples may also contain a large proportion of water, so they should be described as wet or dry and preferably include a wet: dry ratio if given in wet weight. In addition, pyrolysis–gas chromatography–mass spectrometry (GC/MS) is increasingly used to identify and quantify small MP and NPs. This instrument reports MP in concentration (mass), not particle counts.
Additionally, a new paper published by the Southern California Coastal Water Research Project (SCCWRP) workshop series suggested including count and mass data as well as information regarding hazard characterization (SCCWRP 2021).
3.2.4 Documentation of the Sampled Environmental Matrix Amount, Prepared Laboratory Sample, and the Analyzed Sample
Documentation of the mass or volume of the sampled environmental matrix should be recorded. A documented trail of subsamples for extraction and analysis of the sample should be maintained to allow the quantity of MP in the analyzed sample to be related to the quantity of MP in the field sample.
3.2.5 Classification of MP into Size Classes
Nomenclature for size classes of MP is not yet standardized. The use of different units hampers comparability. Common size classes include macro, meso, micro, and nano, and these classes should be defined when first used (Campanale et al. 2020, Cowger et al. 2020).
3.3 Special Considerations for NP
We define NP as a subclass of MP particles with sizes ranging from 1 nm to 1,000 nm. Particles in this subclass have a host of analytical and sampling challenges associated with them given their extremely small size. First and foremost, it is key to understand that some polymer types have different properties within the smaller nanoscale (1–100 nm) than at larger sizes. For example, PE at a certain size threshold will become more wax-like than plastic-like. This is not surprising as a large component of paraffin wax (a primary constituent in candles) is a hydrocarbon polymer chain about 4 nm in length with a similar composition to PE (that is, C31H64). Further, because polymers at this size often lack highly crystalline structures, it is hypothesized that these particles may be more susceptible to biodegradation. Crystallinity in larger MP prevents bacteria and other smaller organisms from degrading the polymeric structure because the MP are simply too large and inflexible to be accommodated within degradative enzyme active sites; this may not be the case for NPs, however.
Methods to isolate and identify NP from environmental samples have not yet been validated (Koelmans, Besseling, and Shim 2015). Flotation and sieving methods traditionally used to separate MP from environmental media may encounter problems of agglomeration, low buoyancy, and adhesion to filter screens (Gigault et al. 2021). Research into new methods for isolating NP is ongoing—leading candidates for isolation include active density separation (centrifugation), field flow fractionation, flow cytometry, and electrostatic methods (Cai et al. 2021, Chen et al. 2022). Likewise, existing identification techniques have limited applicability for NPs. Infrared and Raman spectroscopy, the two most common methods for MP analysis, cannot resolve nanoscale particles because the wavelength of light used in these studies is larger than the particles themselves (Xu, Ou, et al. 2022). Moreover, practical considerations for these methods limit their application to particles 10 µm and larger. Pyrolysis-GC/MS may be used to identify plastic polymers if used in combination with digestion and ultrafiltration steps; however, these methods are not fully developed (Xu, Ou, et al. 2022). Scanning electron microscopy (SEM) has been used by scientists to detect NP in controlled conditions, particularly for known plastic samples that do not need to be separated from additional organic or inorganic matter. SEM is useful because it allows for detection of small particles and provides information on morphology and to some extent location (Zhou et al. 2006). However, resin identification is not possible as SEM can only identify elemental composition and not how the atoms are arranged in molecular bonds, which is required to accurately identify polymer resin types. Research into new methods to circumvent these problems is ongoing—it may be possible to adopt laser ablation techniques, such as matrix-assisted laser desorption/ionization (MALDI), coupled with mass spectrometry, to identify NP (Zhou et al. 2006).
Despite these challenges, the study of NP remains an important active analytical research topic as nano-sized particles can cross cellular membranes and potentially be implicated in both human health and ecological effects.
3.4 Sample Collection Methods by Matrix
This section includes subsections for sample collection methods by matrix. If applicable, both standard methods (for example, ASTM) and other newer methods or methods that may have limitations are provided.
The Sample Collection Tool aids the user in the selection of MP sample collection methods appropriate for the desired study. This tool allows the user to filter by sample matrix and particle size fractions. The tool outputs the available MP sample methods based on the selected inputs and provides additional details, such as equipment needed, advantages and disadvantages, relative cost, and references for additional information.
3.4.1 Water
In 2020, ASTM released the first standard practice for the collection of water samples with high, medium, or low suspended solids for identification and quantification of MP particles and fibers (ASTM D8332-20, ASTM 2020a). This method has been accepted for drinking water, surface waters, wastewater influent and effluent, and marine waters. Briefly, it consists of diverting a large volume of flow (400–1,400 gallons) via a pump or existing sample tap through a series of sieves with increasingly smaller mesh size. This method may also be further modified to apply to additional water matrices through additional validation and testing. Studies have suggested that in-line filtration is the ideal MP sample collection method for water due to the reduced potential for cross-contamination and the consistent, representative results it provides (Yuan et al. 2022).
3.4.1.1 Groundwater
No guidelines or best practices currently exist for collecting groundwater samples for MP analysis. Because collecting groundwater samples will most likely involve a permanent monitoring well made of plastic material (often PVC) and the sample will come in contact with plastic materials (tubing), it will be important to incorporate MP-specific QA/QC protocols, such as the inclusion of equipment blanks.
Special attention should be given to filter size when sampling wells. The filter size must be smaller than the slots in the well screen. Larger MP particles will be filtered out by the well screen prior to sample collection.
3.4.1.2. Surface Water
Standard collection processes for MP in surface water samples range from basic to sophisticated and generally include the following: manually filling sample containers by submerging in surface water body, filtration through a net or sieve, or collection via a pump. Following collection, the samples can be filtered in the field to collect particles within a specified size range. Depending on the specific collection method used, various sampling conditions (for example, sampling equipment, collection duration, water flow rate, depth of sample, etc.) should be recorded.
There are three primary sampling strategies for aquatic sampling: selective, bulk, and volume-reduced (Hidalgo-Ruz et al. 2012, Wang and Wang 2018b). Selective sampling methods are more applicable for MP that are visible to the naked eye. Bulk sampling involves analyzing the entire sample without volume reducing. Volume-reduced sampling reduces the entire volume of a bulk sample via filtration and saving only a small fraction of this sample for further analysis. Wang and Wang (2018b) provided details on the pros and cons of each sampling strategy.
As with other constituents, it is important to consider sampling objectives and site environmental factors when selecting an appropriate sampling method. For example, wind and waves can affect the distribution of MP. The size, shape, and density of MP, as well as the flow rate and flow profile, can also affect the distribution within the water column. Brander et al. (2020) and Miller et al. (2021) provided additional considerations when planning a sampling event. Common surface water sampling methods, applicable to freshwater and marine environments, include nets (Manta trawls and Neuston nets, Figure 3-4), grab samples, and auto samplers. Surface water sampling may also be automated using drone samplers (Norwegian University of Science and Technology 2022).
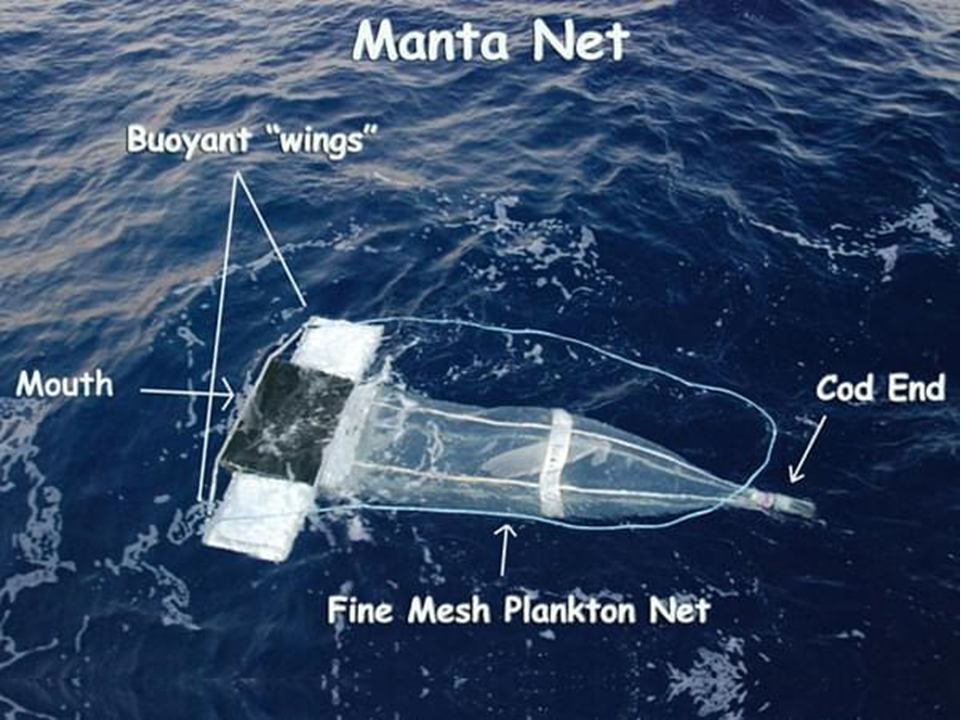
Figure 3-4. Photo of a deployed Manta net useful in trapping microplastics particles of a certain size.
Source: National Oceanic and Atmospheric Administration.
The following provides a brief summary of each method, compiled from Brander et al. (2020) and Miller et al. (2021):
- Manta trawls, Neuston nets, and Bongo nets ▼Read more
- Grab samples ▼Read more
- Pump/autosampler ▼Read more
Guidelines for recommended sampling volumes are set in Koelmans et al. (2019). The recommended sampling volume is at least 500 liters for surface water with 0.001-10 particles/L, with larger volumes recommended for remote areas.
3.4.1.2.1 Freshwater systems—rivers, streams, lakes, ponds, wetlands
Depth-integrated sampling may be the best method for a representative bulk sample in streams (Brander et al. 2020). However, this may depend on the DQOs. If the DQO is to evaluate ecological risk to a specific organism, then collecting a sample at the specific depth associated with the organism’s habitat may be prudent.
3.4.1.2.2 Marine systems—bays, estuaries, open ocean
Marine systems cover approximately 70% of the earth’s surface. They are arguably the most affected and most studied ecosystems with respect to MP. As marine systems are vast and encompass diverse environments, a single method cannot be proscribed for marine sampling. Instead, marine sampling designs must encompass the DQO determined for each study. Generally open ocean sampling designs should consider depth, stratification, currents, mixing layers, and turbulence. Coastal areas should consider the aforementioned factors, as well as the unique circulation patterns of bays and estuaries, freshwater inflows, and anthropogenic inputs unique to the study area.
3.4.1.3 Stormwater Runoff
While discharge is occurring, a sample should be collected from the center of flow of the outlet or from within the stormwater system by submerging the sample container beneath the water level, allowing water to enter directly into the bottle. Depending on the desired DQOs, a time-integrated sample collected across the duration of the storm event could be gathered. Various sampling conditions (for example, precipitation event intensity, presence of floating/suspended/settled solids, etc.) should be recorded.
3.4.1.4 Wastewater
Wastewater samples from influents to polished effluents can either be collected using the ASTM D8332-20 standard method (ASTM 2020a), or other common methods, such as those detailed in Sun et al. (2019). Overall, samples should be collected to maximize stream representativeness and to reduce the variability associated with wastewater; this includes targeting large sample volumes (for example, >1,000 liters) and sampling over a 24-hr flow cycle when feasible. Regardless, collection processes for MP in wastewater samples will depend on the targeted wastewater treatment step and monitoring or research goals.
For treatment process steps with flowing wastewater, permanent or temporary sampling equipment (for example, a submersible pump or autosampler set to deliver sampled water onto a series of stainless-steel sieves) can be installed within the wastewater body. For pressurized wastewater basins, existing sampling taps can be accessed to deliver flow toward a series of sieves. For stagnant wastewater bodies or treatment areas where it is difficult to establish sampling equipment, grab samples can be collected by submerging sampling equipment (for example, telescopic sampling pole, stainless-steel buckets, sample container) directly into the surface of the wastewater body. To provide data that is time-integrated and temporally representative, grab sampling can be conducted at select time intervals to provide a more representative distribution of MP concentrations. If desired, these collected samples can be filtered in the field through a series of stainless-steel sieves. Various sampling conditions (for example, specific sampling equipment, sieve fraction sizes, collection duration, water flow rate, depth of sample, etc.) should be recorded. It is also important to collect other significant wastewater characteristics that might influence MP removal and abundance, including specific treatment technologies used, total suspended solids, and volume treated, etc. (Habib, Thiemann, and Al Kendi 2020, Sun et al. 2019).
3.4.1.5 Drinking Water
Drinking water samples collected from a tap or bottled water can be sieved or filtered at the source. Screens should be removed, and taps should be flushed prior to sampling to avoid potential accumulation in the system. In-line filtration methods where water is filtered on site are emerging as a collection method due to the ability to sample large volumes of water on site and reduce the potential for airborne contamination of the water sample (Yuan et al. 2022). Any treatment of finished drinking water should be noted, as treatment type may alter MP concentrations. Drinking water source type and flow rate, in the case of tap water, should be recorded at the time of sample collection (Koelmans et al. 2019). If the DQO is to assess the treatment effectiveness, it is recommended that samples are taken at both raw/source and finished drinking water taps.
Due to the rapid development of MP studies and literature, recent guidelines developed just a few years prior regarding suggested drinking water sample volumes—for example, 0.5–2 liters by Smith et al. (2019) or 10 liters for bottled water by Koelmans et al. (2019)—are already considered to be outdated. Current guidelines recommend a sample volume of at least 1,000 liters for drinking water monitoring activities (Coffin 2022).
3.4.2 Solids
Solid matrices often integrate environmental conditions over time. Both freshwater and marine sediments, as well as soils, serve as sinks for many anthropogenic compounds, including MP. Solid matrices are often heterogeneous and patchy in nature. The amount collected and the spatial design of the collection should reflect the overall objectives of the study. Details of sample collection in specific matrices are provided in the following sections.
3.4.2.1 Soil
Soil collection methods should reflect the overall objective of the project. For example, if the project goal is to determine ambient air deposition or stormwater resuspension/runoff potential, samples should be collected from the soil surface. However, deeper cores may be appropriate for insight into historical human activities or temporal changes in deposition. The location, historical property use, surface cover, biological activity, and general soil characteristics can all affect the distribution and abundance of MP, and these factors should be taken into consideration when contemplating the project design and relevant collection methods.
Soil environments are heterogeneous and discontinuous on a spatial scale; as such, it is very important to set up a sampling strategy that captures the variability within a specific sampling site across space and by depth. Different sampling strategies can be employed to obtain a representative sample at a given site, including random sampling, transect sampling, and incremental sampling methodology (ITRC 2020). Where resources are limited, several samples could be combined to form a composite sample to reduce the number of samples to be analyzed. Important considerations during sampling include ensuring that all samples are collected at the same depth, avoiding cross-contamination of samples during sampling, using appropriate cleaning procedures for sampling equipment, and using nonplastic sample collection and storage containers.
Soil samples can be collected by pushing a sample corer (for example, hand auger or direct push split spoon sampler) into the soil column or collecting a grab sample from the soil surface. Using a corer allows for the collection of a sample at a discrete or deeper depth interval. Vegetation should be removed from the sample matrix. If mass reduction or sample splitting in the field is necessary, refer to Section 4.6 of ITRC ISM-2 (ITRC 2020).
3.4.2.2 Sediment
Sediment collection methods should reflect the overall objective of the project. For example, if the focus is on the biologically active fraction of the site, collect approximately the top 5 cm of sediment. For insight into historical accumulation at a site, cores may be more appropriate. When collecting sediment in conjunction with or at the same location as surface water, sediment sample(s) should be collected after the collection of water sample(s) to avoid sediment disturbance and suspension into the water column. The depth, currents, organism activity, and general sediment characteristics can all affect the distribution and abundance of MP, and these factors should be taken into consideration when contemplating the study design and relevant collection methods.
Sediment samples can be collected by pushing a sample corer into the sediment column or collecting a grab sample (for example, using a bucket/scoop sampler). Using a corer allows for the collection of a sample at a discrete or deeper depth interval. A grab sampler can be used to collect surface sediment samples. The grab sampler should be deployed with as little disturbance to the sediment as possible. After retrieving the sampler, carefully empty it into a nonplastic tray to preserve the sediment layers. If mass reduction or sample splitting in the field is necessary, refer to Section 4.6 of ITRC ISM-2 (ITRC 2020).
Specific considerations for MP sediment collection (USEPA 2020) include minimizing exposure to fraying ropes or other plastic items that may be onboard collection vessels; this is critical to decrease MP contamination. If life jackets are in use, note their color, and avoid those with shedding straps or materials. If plastic debris is present on the boat (that is, shedding equipment or rope), take a small sample of plastic and retain it in aluminum foil for potential analysis. This will help reduce uncertainty in air-blank contamination.
If sediments are subsampled onboard, ensure that vessels and equipment used are plastic free and rinsed before use, and air blanks are used appropriately to capture any incidental contamination.
3.4.2.3 Pore Water
Traditionally, pore water samples can be collected through bulk/active sampling methods, such as direct push pore water samplers/probes, modified piezometers, or sediment grab samples. Sediment may also be collected using a stainless-steel sampler and centrifuged in a lab; however, this typically requires a large volume of sample matrix. Modified piezometers can often supply up to 1 liter of water per sample; however, these are made of PVC that may lead to sample contamination. Direct push pore water samplers/probes are generally both stainless-steel based. Direct push pore water samplers are easy to use but are limited to a smaller volume of water. A plastic syringe or peristaltic pump may be used to draw water from it, along with plastic-based tubing. If this method is used, include equipment blanks to account for any possible sample contamination by plastic particles shed from equipment.
3.4.2.4 Biosolids
Wastewater sludge and biosolids share many similar characteristics to soil and sediment and can be collected in many of the same ways as for these matrices. The most common method of collection for sludge and biosolids is to collect grab samples at a location where the samples will be representative of treatment. Sample volumes up to 250 g should be collected into glass or stainless-steel containers using a stainless-steel spoon or scoopula if necessary (Lares et al. 2018, Lusher et al. 2017). If possible, multiple samples should be collected throughout the day and composited together to create a more representative sample for analysis. Consider adapting the principles described in ITRC ISM-2 Section 4 (ITRC 2020). Similarly, consideration should be given toward collecting multiple composited samples throughout the week to assess and determine their variability (Lusher et al. 2017). Additional data should also be collected to characterize and account for the dry weight and organic content of samples.
3.4.3 Air
All airborne MP morphologies tend to follow the same distribution pattern: an increasing number of particles at lower size ranges (Brander et al. 2020). The low µm size of airborne MP particles makes sample collection challenging. Most limits of detection for visualizing particles with the naked eye are in the 50–200 µm range (Brander et al. 2020). Designing a sampling protocol with objectives and research questions in mind is an important planning step and will drive many sampling decisions. As of 2021, airborne MP sample collection procedures and pretreatment protocols are only in the early stages of development. There are two sampling scenarios for airborne MP:
- deposition on land and water from MP particles that settle out of air
- suspension in the air, which can allow MP, dependent upon particle size, to travel long distances (Brander et al. 2020)
MP that settle out of air are typically sampled using a passive collection method such as total atmospheric deposition (Zhang, Zhao, et al. 2020, Zhang, Kang, et al. 2020). Atmospheric deposition can be dry or wet. Passive deposition samplers use gravity to remove dry particles by sedimentation or wet particles by precipitation (Knobloch et al. 2021). Passive total or bulk deposition samplers are easy to use, support sample collection consistency through use of a standardized method, and do not need a power source (Liao et al. 2021). Knobloch et al. (2021) tested several low-cost passive sampling options for MP that settle out of air. The team found that an adhesive sampler (that is, a petri dish covered in double-sided adhesive tape) is not a useful method to collect airborne MP, an automatic wet deposition sampler is of limited use because low rainfall can prevent samples from being collected, and simple equipment consisting of a funnel over a collection bottle or an open beaker was reliable for collecting atmospheric fallout. For reporting purposes, the area of the moistened filter paper, petri dish, or funnel used to collect MP fallout should be recorded (Brander et al. 2020).
Deposition sampling does not accurately measure airborne MP that may be suspended in air and subject to inhalation. MP suspended in air may be measured using active pump samplers, which pass known volumes of air through a collection filter over various time periods at selected locations (Liao et al. 2021). Airborne MP can be collected using a total suspended particulate sampler equipped with glass microfiber filters. Mechanisms of particle capture for airborne filtration include impaction, interception, sedimentation, Brownian motion/diffusion, and electrostatic attraction. The filter pore size and diameter should be selected to capture the size range of MP targeted. The sampler can be placed on a stationary tripod adjusted to the average height (for example, 1.2 m) for human inhalation, worn for personal sampling, or placed on a rooftop for large-scale background sampling. After filtration, filters should be carefully removed and immediately transferred using metal forceps into a nonplastic, sealed sample collection container (Liao et al. 2021). A drawback to active pump samplers is that hundreds to thousands of liters of air are required to collect enough MP on a filter paper or in a mesh bag to analyze (Brander et al. 2020). For reporting purposes, the volume of air filtered and MP counts per volume (liter or cubic meter) of air filtered should be recorded. Counts can be made using in-line flow meters or totalizers (Brander et al. 2020). Velimirovic et al. (2021) listed a variety of other types of active samplers that are currently used to sample indoor dust, but may, with development, be used for MP: stationary cascade impactors, stationary cowled sampling heads, and personal cascade impactors.
Guidelines for estimating human exposure to MP through inhalation can be found in Wright et al. (2021).
3.4.4 Biota
The chemical composition, additives, and adsorbed pollutants associated with MP when ingested, inhaled, or contacted by biota may impair critical body functions and influence the functional role the organism fulfills in the food web and in the ecosystem. Biota from various habitats (aquatic and terrestrial) and various parts of organisms (such as tissue, gills, organs, digestive tract) can be used to monitor MP in the environment. Permits may be required for biota collection. There is currently no consensus for choice of species or monitoring strategy for biomonitoring (Brander et al. 2020). A baseline method/harmonized protocol was developed in 2018 for sampling and processing targeted biota (for example, bivalves, benthic macroinvertebrates, and fish) and for extracting and characterizing MP in biota samples (Bessa et al. 2019). The tissue or organ sampled should be dependent upon the DQO of the research. For example, if human exposure is a research objective, fillet or muscle tissue of fish should generally be sampled (unless the species is generally consumed whole—for example, anchovies). The following criteria were recommended for selecting appropriate species for MP monitoring (Bessa et al. 2019):
- species that occur naturally with high abundance and wide geographic distribution
- species that are easy to sample and process in the laboratory
- species that are already used as bioindicators for biomonitoring in other studies
- species with ecological and socioeconomic relevance
- species that cover several ecological/functional roles, niches, or feeding guilds
In addition to the above criteria, particulate feeding habits of organisms must be considered. Filter feeders that selectively discriminate against particles with specific size, surface area, or morphology (that is, fragment vs. fiber) should not be used (Ward et al. 2019). Marine, aquatic, and terrestrial biota can be sampled by various methods—for example, trawl nets (for example, Manta, plankton, seine), kick or D-frame nets, cages, traps, or manual collection by hand. For small species, Bessa et al. (2019) indicated that a sample size of at least 50 specimens of similar size per research unit (species, food web, feeding type, etc.) be collected to represent the population. When smaller sample sizes are used due to resource constraints or as indicated by statistical power analysis, justification should be documented (Bessa et al. 2019). In all cases, efforts should be made to reduce the number of organisms collected and to use humane methods of capture and handling to minimize the impact on biota and their environment.
Additional methods for various specific biota types, such as plant matter (Oliveri Conti et al. 2020) and biofilm (Glaser 2020, Parrish and Fahrenfeld 2019), have been proposed and are included in the Sampling Tool.
MP loss may occur between sampling collection and preservation. Gut evacuation times vary between organisms and loss of MP may occur via egestion; therefore, it is important to minimize the time it takes to preserve samples (Lusher et al. 2020). Stress due to handling may also result in the organism regurgitating, which can bias MP counts if the gut is being analyzed (Lusher et al. 2020).
Traditional preservatives such as formaldehyde and ethanol can degrade certain polymers; therefore, it may be beneficial to consider desiccation or freezing to preserve samples (Lusher et al. 2020).
3.5 Sample Preservation
Plastics are generally recalcitrant and not prone to rapid degradation, hence our problem in the environment (Gerritse et al. 2020). Plastics that are dry (for example, on slides or filters) can be stored at room temperature out of direct sunlight. Long-term storage of plastics in aqueous or wet matrices (for example, sediment, water) should occur at 4ºC in the dark to prevent or slow bacterial degradation and ensure UV degradation does not occur. A preservative may be added dependent upon the DQO, and if it does not interfere with future analysis. However, for short periods of time, such as in transit from field to laboratory, or in between laboratories, room temperature storage is adequate. Multiple freeze and thaw cycles are not recommended as plastic particles may crack and further degrade. However, for storage of samples that easily degrade, such as biota or biosolids, one freeze and thaw cycle that is consistent with sample storage may not damage particles. For long-term storage of bulk samples, it may be advisable to reduce or remove the organic liquid fraction of the sample through sieving, rinsing, and cleanup procedures (for example, digestion) prior to storage to prevent sample degradation or fouling (Hidalgo-Ruz et al. 2012).
3.6 Sample Preparation
Most environmental samples will have some degree of organic matter and suspended solids content that will require removal or purification before MP can be extracted before identification and quantification. Sample preparation is a necessary step to minimize false positives and increase efficiency and effectiveness of sample characterization. Extraction methods for Fourier transform infrared spectroscopy (FTIR), Raman, laser direct infrared spectroscopy (LDIR), and to some extent, pyrolysis–gas chromatography–mass spectrometry (GC/MS) all have similar preparation steps before identification. These steps usually involve removal, concentration, and cleanup from the environmental matrix. The steps required and the degree of organic removal is matrix-specific; see specific matrices below for more details.
3.6.1 Water Samples
There are many variations in existing methods for the processing of aqueous samples (reviewed by Andrady 2011, Hidalgo-Ruz et al. 2012, Koelmans et al. 2019, Prata, da Costa, et al. 2019, Wang and Wang 2018b). Processing of all water samples typically follows the same or similar processing steps. Generally, during or after water samples are collected, they are often poured through metal sieves to reduce the sample volume for processing, and to classify particles by general size bins of interest. Materials captured on the sieves can be transferred back into containers for removal of organic matter through digestion or oxidation procedures, poured through filters for quantification and analysis, or transferred into dishes for wet sorting, quantification, and analysis. Samples may also be directly filtered for those with cleaner matrices or if size fractionation is not required. The degree of sample processing and oxidation required to treat water samples will depend on the amount of organic matter present, suspended solids, and interferences such as algae or debris.
In 2020, ASTM released the first standard practice for the collection and preparation of water samples with low to high suspended solids for identification and quantification of MP particles and fibers using Raman spectroscopy, IR spectroscopy, or pyrolysis-GC/MS (ASTM D8333-20, ASTM 2020b). This method has been validated for drinking water, surface waters, wastewater influent and effluent, and marine waters and is recommended for the processing of these samples. Briefly, organic matter is removed through a wet peroxide oxidation followed by enzymatic digestion to remove remaining cellulose, lipids, and chitin. Cleaner samples such as drinking water or tertiary treated effluent may not require oxidation or digestion steps.
3.6.1.1 Drinking Water and Groundwater
Public drinking water and bottled water present a less complex matrix than other types of media due to treatment and filtration processes used to make the water safe for drinking (Smith et al. 2019). Most of the time, studies have used direct filtration of samples through filters or sieves to recover MP from raw or treated water, bottled, or tap water. When selecting size of filter and volume to be filtered, it is important to consider the type of sample to be filtered—that is, tap water, bottled water, or raw water—as that might influence the overall particle size ranges/distribution. If necessary, subsampling or filtration of samples through filters of different sizes could be incorporated to avoid clogging of filters and to reduce number of particles. For samples containing a large amount of background interference, prefiltration steps including cation exchange columns can be incorporated as necessary to remove calcium and magnesium cations and iron precipitates and to dissolve organic matter.
Specific considerations during direct filtration of samples include:
- Samples should be well mixed by gentle agitation prior to filtration.
- Any devices used for filtration should be well rinsed to remove any particles around the filtration surfaces.
- Laboratory blanks should be incorporated to determine the potential contamination of samples by external particles during sample analysis.
Recently, the California State Water Board adopted Raman (>20 µm in size) and FTIR methods (>50 µm in size) for MP identification in drinking water samples (CA SWRCB 2021b, a).
3.6.1.2 Surface Water and Porewater
Surface waters and porewaters will include many of the same processing steps as for drinking water and groundwater; however, more intense organic matter digestion or oxidation may be required. This could include a more aggressive digestion procedure, or additional and/or longer oxidation steps.
3.6.1.3 Wastewater and Stormwater
Procedures for the preparation and separation of MP from wastewater and stormwater samples will have many similarities to those used for surface waters. The degree of sample purification or processing required will depend on the amount of organic matter and suspended solids present in the sample, which can be inferred by measuring a sample’s total dissolved solids (TDS) or conductivity. For example, raw sewage, influent, and first flush stormwater will likely require more sample processing than treated effluents, and a test processing step may be helpful to determine what level of oxidation is required. Generally, wastewater and stormwater samples will require an extensive organic matter digestion/oxidation step following sieving through mesh sieves to reduce sample volume. Materials collected on sieves can be rinsed back into a beaker or flask and subjected to oxidation using ASTM D8333-20 (ASTM 2020b) or other digestion procedures using hydrogen peroxide, Fenton’s reagent, enzymes, or acidic or basic digestions (Habib, Thiemann, and Al Kendi 2020, Sun et al. 2019, Wang and Wang 2018b). As with all analyses, additional processing steps can result in loss of analytes, and positive spiked blanks should be used to determine percent recoveries.
3.6.2 Solid Samples
Solid matrices such as sediments, soils, and biosolids present a unique challenge to MP extraction. The complex organic carbon matrix of these samples can confound identification of MP (which are also carbon based). In addition, the mineralogy of these samples often has a similar density to MP and is extracted along with MP in density separations. Many methods exist to extract MP from these matrices (Adomat and Grischek 2021, Besley et al. 2017, Cadiou et al. 2020, Cashman et al. 2020, Claessens et al. 2013, Coppock et al. 2017, Crichton et al. 2017, Fu et al. 2020, Herrera et al. 2018, Hung et al. 2021, Karlsson et al. 2017, Masura et al. 2015, Miller et al. 2021, Nguyen et al. 2019, Nuelle et al. 2014, Piehl et al. 2018, Prata, da Costa, et al. 2019).
Methods to extract MP from solid matrices generally include size separation (for example, sieves), a density separation, and then an oxidation step (Hidalgo-Ruz et al. 2012, Van Cauwenberghe et al. 2015). Density separation takes advantage of the lower density of many plastic polymers and involves mixing and incubating a sample with a high-density salt such as NaCl, NaI, ZnCl, etc. Floating or neutrally buoyant particles are retained for analysis, while heavier particles that often include mineral and inorganic content are discarded. For denser MP such as TWP or PVC, a denser salt solution should be used to ensure that these particles are removed (Klöckner et al. 2019). The same or similar oxidation or digestion procedures as used for water matrices can then be applied to sediment matrices before or after density separation (Hurley et al. 2018). The particles are often collected on a filter or membrane for further identification via a spectroscopic or other means of chemical identification. Practices to avoid are (Cashman et al. 2022):
- drying sediment—drying is a reasonable practice for sand, but not sediment, as dried sediment can become a solid hard mass that is difficult to sieve or to further process
- pouring liquids that include MP from the tops of beakers—particles cling to the glass beaker and are difficult to remove)
- excessive transfers—particles are lost during transfers
Additional glassware rinsing using the density separation salt or deionized water (DI) during processing may also increase recovery by containing MP that may float and stick to glassware (De Frond et al. 2022). The Southern California Coastal Water Research Project (SCCWRP) performed a round-robin using a series of methods for sediments and other matrices (De Frond et al. 2022).
Regardless of the method chosen, it is important to use a spiked control so one can quantify the percentage recovery of appropriately sized MP.
3.6.3 Air Samples
Air samples contain natural particles that need to be removed using a digestion treatment to improve the detection and identification of MP in the sample. Airborne particles on the filters should be washed into a glass beaker containing an oxidizing agent (for example, hydrogen peroxide, 30%) then heated (for example, to 70ºC for 1 hour) to remove natural organic matter (Liao et al. 2021). Other digestion methods may also be used (for example, wet acid treatment, alkaline digestion, or enzymatic digestion). After digestion, the remaining particles can be filtered and stained (for example, using Nile Red) prior to analysis. Preconcentration techniques (for example, filtration, density separation, centrifugation) of sample extracts should also be considered to allow sufficient concentration of low µm-range MP before further analysis (Velimirovic et al. 2021).
3.6.4 Biota Samples
Organisms should be measured and weighed in the laboratory prior to extracting target tissues (Bessa et al. 2019). Extraction of tissues will depend on the project DQOs; for example, the full gastrointestinal tract of fish or the entire body of small invertebrates (for example, bivalves, benthic macroinvertebrates) can be extracted and stored in covered glass containers (Bessa et al. 2019).
When digesting biota samples, avoid using chemicals that can cause damage to plastic polymers’ composition or morphology (Bessa et al. 2019) if physical characteristics of MP are important. A variety of digestion approaches exists. Hydrogen peroxide (15%), potassium hydroxide (10%), and enzymatic digestion are nondestructive; alkaline digestion, acid digestion, and hydrogen peroxide (30%) may be destructive. Each approach has advantages and disadvantages, and approaches may be combined to achieve project goals.
Increased efficiency of the sorting and characterization steps can be obtained by removing dense inorganic particles by digestion followed by density separation. A variety of solutions can be used to perform density separation. Denser solutions are more appropriate for projects targeting PVC, PET, and other dense polymers (Bessa et al. 2019).
Dissection, depuration, homogenization, and digestion of tissues with chemicals or enzymes are methods that can be used to extract MP from biota (Lusher et al. 2017). Dissection of the gastrointestinal tract is the primary method for assessing MP content in larger animals. If accumulation is the primary focus, then depuration should be used to remove transient MP particles in the intestinal tract. Depuration ensures only MP retained within tissues or entrapped in the intestinal tract are considered. While depurating, exposure water should be refreshed frequently to avoid consumption of the egested particles (Lusher et al. 2017).
Biological material, biofilms, and algae can make it more challenging to identify MP particles. Therefore, digestion can be used to isolate MP particles extracted from tissues or environmental samples. Traditional digestion chemicals can damage or degrade certain polymers. Lusher et al. (2020) provided chemical resistance data related to MP analysis in tissues.
Edible tissues can be analyzed for human health considerations, and MP present in dissected tissues can be isolated using saline washes, density flotation, visual inspection, or digestion (Lusher et al. 2020).
3.7 Analysis and Identification
3.7.1 General Considerations
Screening methods such as Nile Red staining exist (Erni-Cassola et al. 2017) and may be a useful first step under some circumstances, but positive chemical identification of particles is critical to accurate quantification of plastics in environmental samples. Plastics can mimic naturally occurring materials and vice versa. Interlaboratory studies have demonstrated that excellent recovery and chemical identification for particles greater than 50 μm in size is possible (De Frond et al. 2022). Instrumentation allows us to identify specific polymers of plastic that may allow for source tracking and possible remediation. Instrumentation and methods are rapidly advancing as manufacturers recognize the need for plastic polymer identification. Identification of MP can be either destructive or nondestructive. Nondestructive methods (for example, FTIR or Raman) allow physical characteristics (that is, size, shape, and color) of MP to be characterized. Destructive methods (for example, thermal degradation methods such as pyrolysis-GC/MS) are potentially faster and provide polymer mass (weight), but the process destroys the physical characteristics of the MP particles. Pre-sorting MP particles into size classes may offset this disadvantage (Bessa et al. 2019).
Analytical methods are summarized in Table 3-1.
3.7.2 Detection Approaches
MP can be detected using several different methods:
- visual methods. Visual examination of a sample with or without magnification.
- spectroscopic methods. Capture and assign the characteristics of specific chemical structure of polymers using reference spectra.
- thermoanalytical/chemical methods. Pyrolyze the sample under inert conditions and specific decomposition products of the individual polymers are detected.
NP methods are under development. It is likely that multiple analytical methods used in combination will be needed to detect and quantify these very small particles (Enyoh et al. 2021). For particles down to 600 nm, an emerging technique, optical-photothermal infrared (O-PTIR) microspectroscopy that can provide 3D images of cells and organisms, may be useful (Su et al. 2022). Other promising techniques include laser diffraction spectroscopy, field emission scanning electron microscopy with energy dispersive x-ray, tip enhanced Raman spectroscopy, and infrared nanospectroscopy (Enyoh et al. 2021).
Table 3-1. Summary of microplastic characterization techniques
| Description | Analysis Time/ Sample | Size Detection Limit | Measurement Preparation | Identifies Polymer Types | Detects Additives /Surface Chemicals | Detects Particles or Mass |
| Visual Methods | ||||||
| NE Naked eye |
Hours | 1 mm | None | No | No | Particle |
| SM Stereo microscopy |
Hours | 100 µm | On filter | No | No | Particles |
| FM Fluorescence microscopy |
Hours | 50 µm
(Possibly smaller based on objective lens used) |
On filter | No | No | Particles |
| SEM Scanning electron microscopy |
Hours | 0.001 µm | On filter | Yes | No | Particles |
| Spectroscopic Methods | ||||||
| FPA-FTIR Focal plane array-Fourier transform infrared spectroscopy (in transmission mode) |
Hours | 20 µm | On special filter | Yes | No | Particles |
| FTIR Fourier transform infrared spectroscopy (in transmission mode) |
Days | 20 µm | On special filter | Yes | No | Particles |
| LIDR Laser direct infrared spectroscopy |
Minutes particles/ hour | 20 µm | Special microscope slide | Yes | No | Particles |
| NIR, vizNIR Near infrared spectroscopy, visible-near infrared spectroscopy |
Hours | Unspecified | On filter | Yes | Surface Chemicals only | Particles |
| Raman Spectroscopy |
Days | 1 µm
(Theoretically but challenging to achieve) |
Extraction and placed on filter | All polymers | Yes | Particles |
| Thermoanalytical/Chemical Methods | ||||||
| DTSC+TGA Differential scanning calorimetry+ Thermal gravimetric analysis |
Hours | Unspecified | Filtrate | Yes, only PE, PP | No | Mass |
| Py-GC/MS Pyrolysis–gas chromatography–mass spectrometry |
Hours | <1–0.5 µg | Isolated particles | Yes | Yes | Mass |
3.7.3 Identification Methods
3.7.3.1 Microscopy
Microscopy can be used as a tool when separating particles for further identification with a spectroscopic method (discussed above). It has limited use for positive identification as many particles (natural and anthropogenic) have similar appearances. For larger particles (>500 µm) hot needle (De Witte et al. 2014) method microscopy may be useful as a screening method, particularly for education and outreach programs.
3.7.3.2 Fourier Transform Infrared Spectroscopy (FTIR)
Fourier transform infrared (FTIR) spectroscopy uses broad frequency infrared light to illuminate samples. The spectrum of absorbed frequencies provides structural information regarding the types of organic compounds that compose the MP particles. FTIR can be operated in reflection, transmission, or attenuated total reflectance mode. A micro-FTIR using attenuated total reflectance mode can analyze particles as small as 20 microns in size. Many different plastics and natural materials can be identified, including PET, PVC, polytetrafluoroethylene (PTFE), polyurethane (PUR), PA, polystyrene (PS), PP, and PE (Figure 3-5).
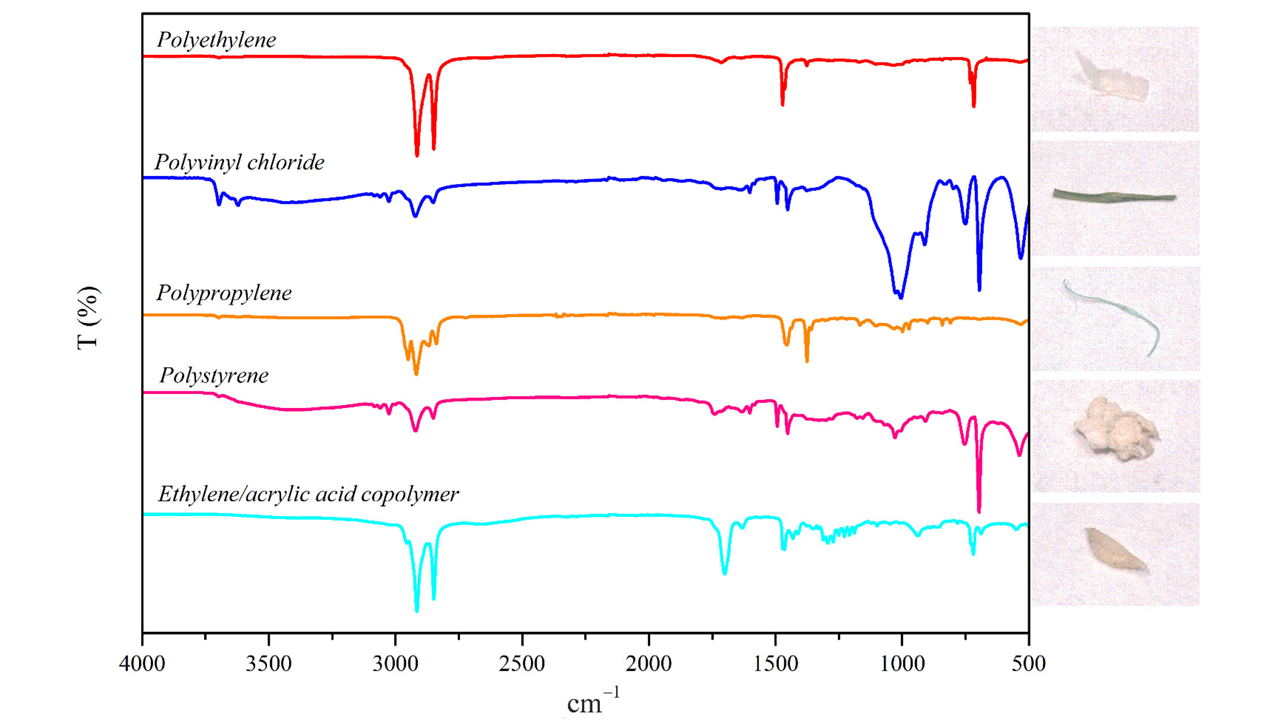
Figure 3-5. Polymers identified in selected MP samples identified by micro-FTIR.
Source: Li, Wang, et al. (2021)
Prior to FTIR analysis, MP are generally extracted or concentrated. For drinking water, a clear water sample (for example, bottled or potable water) (0.5–2 liters) is filtered through a silicon wafer (1 µm porosity). Particles in the 32–350 µm range are counted.
Spectrophotometric methods such as FTIR or Raman microspectroscopy (µRaman) have inherent size limitations due to wavelength of the light source and interference from other particles (see Section 3.7.3.5 for additional information on Raman microspectroscopy). The lowest size limit for detection is 10 µm for FTIR and 0.5 µm for Raman (Velimirovic et al. 2021).
Recently, the California State Water Board adopted an FTIR method for MP identification in drinking water samples (CA SWRCB 2021a).
Key Advantages (in General)
- most effective for particles >50 µm
- nondestructive
- can be used on fluorescent samples
Current General Technique Limitations
- less effective for translucent polymers
- less effective for particles <50 µm
3.7.3.3 Pyrolysis and Thermal Extraction and Desorption GC/MS (TD/GC/MS)
Pyrolysis and GC/MS. A pyrolizer coupled with a GC/MS is used for polymer analysis. Particles are introduced into the pyrolyzer and thermally degraded into various compounds in an inert atmosphere. When polymers are pyrolyzed the resulting gas contains compounds unique to the polymer in question. By introducing this gas into a GC/MS, the identity of these compounds can be related to various polymers. Thus, individual polymers can be identified in a range of sample matrices.
The methods used during sample preparation vary greatly with different samples, but after sample prep the sample is contained on a filter of a predetermined pore size, according to the sample composition and analytical goals. An inert filter with collected material is dried in a desiccator and placed in a sample cup. The sample cup is pyrolyzed at different temperatures in a helium atmosphere. Individual polymers produce unique compounds that are identified based on mass spectra and retention times. Quantification is based on calibration curves for each polymer.
This method is suited for qualitative and quantitative determination of the following polymers: PE, PP, PVC, PC, PS, PET, polymethyl methacrylate (PMMA), and PA. The method also includes determination of common rubber components polybutadiene and polyisoprene.
Thermal Desorption and GC/MS. Like pyrolysis, the thermal desorption method (TD/GC/MS) is based on obtaining decomposition or cracking products which are created when a polymer undergoes breakdown in an inert atmosphere, due to the action of heat. The effects of this action can be very different depending on the composition and chemical structure of the polymer (La Mantia et al. 2017). In general, high thermal exposure results in the formation of volatile products, the nature of which is dictated by the chemical and physical properties of both the polymer and the decomposition products (Beyler and Hirschler 2002). In TD/GC/MS, the degradation is controlled to obtain the most volatile fraction of the sample, without exceeding 380ºC. The samples are filtered onto a conditioned quartz filter and introduced into the TD system. The compounds obtained from their degradation are concentrated in a cold trap at -15ºC and subsequently introduced into the GC/MS system by ballistic heating. Similarly, the calibration curve is made with the degradation ions characteristic of each polymer. USEPA Method 8275A could be extended to include the decomposition products of MP (USEPA 1996).
The preparation of the samples depends on the characteristics of each matrix, and once the sample has been treated, it is easy to introduce it into the TD tube for analysis by TD/GC/MS.
Key Advantages
- more easily applied to small particles than spectroscopic techniques up to 0.3 µm
- shorter sample preparation time
- reports polymer mass detected by degradation products
- can report polymer additives
- high level of automated instrumental analysis
- easier interpretation of raw data chromatograms
Current Technique Limitations
- does not report number of particles, size, or shape
- degradation products not always unique for each polymer
- larger particles may overwhelm signal from smaller particles
3.7.3.4 Laser Direct Infrared Microscopy (LDIR)
The laser direct infrared (LDIR) imaging system is an infrared (IR) spectrometer using a quantum cascade laser (QCL) as a light source that is coupled to a rapidly scanning imaging system (Scircle et al. 2020). The instrument was originally designed for the pharmaceutical analysis of tablets, laminates, tissues, and fibers, but can also be used to analyze MP. The imaging system provides information on particle enumeration, size, and morphology, while the polymer type can be identified by the spectrometer.
For an IR analysis, the imaging system scans the sample on an IR reflective slide to identify, measure, and quantify the particles between 20 and 500 µm. There is an option of using the integrated high-resolution camera to take individual pictures of the particles and save them as PNG files. Each particle is then scanned and an IR spectrum in the fingerprint region (975–1800/cm) is generated (Scircle et al. 2020). This is then matched to a library and a hit quality is calculated. The workflow is fully automated by the acquisition software, and the size of the scanned area can be customized but is limited to size of the slide.
For particles greater than 500 µm, the instrument is equipped with an ATR (attenuated total reflectance) module. This is a germanium crystal that can be lowered onto a particle and a full spectrum can be obtained. This can then also be compared to a library to obtain a hit quality.
The instrument software comes with a published library (Primpke et al. 2018) for all the most common polymer and nonpolymer spectra. However, it can also be customized by generating a spectrum and manually adding it to the library.
Key parameters including width (µm), diameter (µm), area (cm2), eccentricity, circularity, solidity, identification, and quality of match are reported for every particle.
Key Advantages
- The main element that gives the LDIR an advantage over other IR spectrometers (for example, FTIR) is the QCL, which is fast tunable and generates a spectrum in the fingerprint region faster than the conventional spectrometers.
- The software includes magnification and sizing tools and the ability to analyze a single particle and to define a line profile. The line profile is very useful when trying to analyze fibers. Once the length of the fiber is selected, the software will take as many spectra as the user defines along the fiber and combine all the spectra to create one spectrum, which can be run against the library.
Current Technique Limitations
- It is not possible to do in situ filter analysis with the instrument.
Application
LDIR has been applied to MP in matrices such as water (potable/environmental/waste), biosolids, sediment, soils, biota (for example, oysters and other mollusks) and food products (for example, salt, rice) routinely but also other specific client requests. The instrument works well for these purposes. However, as the analysis time is proportional to the number of particles detected (250 particles/h), a good sample cleanup is imperative. The eight most common polymers detected in the environment (PE, PP, PS, PVC, PET, PC, PMMA, and PA (Mammo et al. 2020) are reported. For quality control purposes, blank samples and laboratory control samples with PE certified reference material beads in two sizes (75–90 µm and 250–300 µm) and PS (30 µm) are prepared and run to quantitate the loss during sample preparation.

Figure 3-6. Sir Chandrasekhara Venkata Raman.
Source: Nobel Foundation
3.7.3.5 Raman
Raman is a spectroscopic method that relies on inelastic scattering of molecules to create a unique spectrum of molecules (an effect discovered by Sir Chandrasekhara Venkata Raman, who earned a Nobel prize in 1930 for this work, Figure 3-6). It is a nondestructive method capable of identifying MP particles from 5 mm to 1 µm. Newer Raman instruments can scan filters in a semi-automatic mode. Methods for general Raman operation exist (ASTM D8333-20, ASTM 2020b), but details to operate Raman instrumentation are typically manufacturer-specific. Recently, the California State Water Control Board adopted Raman methods for MP identification in drinking water samples (CA SWRCB 2021b). The lowest particle size reliably detected by this method is 20 µm (CA SWRCB 2021b); however in theory, Raman can detect particles to 1 µm.
Key Advantages
- effective for particles <10 µm
- effective for translucent polymers
- not hindered by water, thus it can be used in sample preparation
- can perform analysis directly on filter media
- can distinguish the types of bonds between carbon atoms in the polymer aiding identification
Current Technique Limitations
- less effective for fluorescent samples
- less effective for completely black particles
- laser may destroy a particle before a spectrum is obtained
3.7.3.6 Spectral Libraries
Several spectral libraries for Raman and FTIR exist. In addition to those that can be purchased or are part of an instrument package, open-source spectral libraries for Raman and FTIR include Open Specy (Cowger et al. 2021), SloPP and SloPP-E (Rochman Lab 2022), and Systematic Identification of MicroPlastics in the Environment (siMPle) (Primpke et al. 2020). In addition, each instrument is slightly different, so it is recommended that researchers develop individual libraries consistent with their instruments.
4 Human Health and Ecological Effects
A primary concern of MP pollution is whether they represent a risk to human health and ecosystems. This section presents information on (Figure 4-1):
- factors that influence the effects and toxicity of MP
- effects on human and ecological health due to exposures to MP in different environmental media and settings
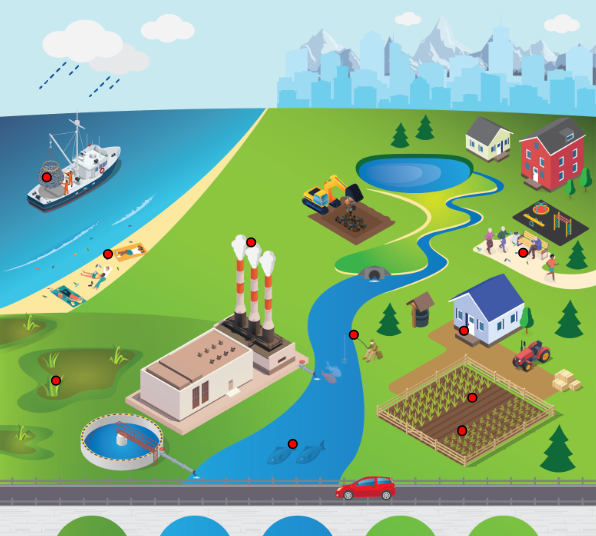
Figure 4-1. Conceptual model for human health and ecological effects.
Source: Jonathan McDonald and ITRC MP Team
Adverse effects on organisms that are exposed to MP can be separated into two categories: chemical effects and physical effects (Campanale et al. 2020). Understanding the effects of MP is complex due to different chemical and physical properties that make MP multifaceted stressors.
4.1 Chemical Properties
MP dispersed in the environment can contain substances that are not chemically bound to the polymer matrix. These substances may be derived from two sources: (1) additives and polymeric raw materials (for example, monomers or oligomers) originating from the plastics, and (2) chemicals absorbed from the surrounding environment (Campanale et al. 2020). These unreacted monomers, residual processing aids, and additives may be released during the plastic life cycle, potentially resulting in human and environmental exposure (Wiesinger, Wang, and Hellweg 2021).
Aging processes such as UV irradiation, biodegradation, physical abrasion, and chemical oxidation can affect the environmental behavior of MP. Different aging processes could affect the adsorption of pollutants, the leaching of additives, and the toxicity of MP (Luo et al. 2022). Luo et al. conducted a systematic analysis and summary of the environmental behavior and physicochemical properties of MP, as well as changes due to MP aging. The aging of MP affects their adsorption performance toward pollutants due to a series of changes in their specific surface area and oxygen-containing functional groups.
4.1.1 Polymer Type and Additives
Microplastics are composed of a diverse suite of polymer types. All plastic polymers consist of repeating monomers, which form the backbone of the polymer. This backbone structure is the fundamental difference between polymer types, informing a plastic’s physical and chemical properties (Rochman et al. 2019). Several studies have suggested that the toxicity of MP depends on their polymer type, as well as on their size and shape (Rochman et al. 2019). It is important to distinguish between the toxic potential of plastic constituents and the potential for MP to release those constituents in the environment. Release of a constituent is based on the chemical properties of the polymer, the properties of the constituent, and the media into which it is being released (Teuten et al. 2009).
Different polymer types have different residual monomers that differ in toxicity; however, there is no reliable evidence that polymers themselves differ in toxicity. Some polymers, such as PVC and PUR, contain variable amounts of residual monomers that are carcinogenic or mutagenic at high concentrations, whereas the monomers from other polymers, such as PE and PP, are considered to have less significant hazard traits and endpoints (Rochman et al. 2019). Constituents of PVC can include carcinogens, such as diisononyl phthalate and di-2-ethyl-hexyl phthalate; a developmental toxicant, for example, diisodecyl phthalate; chlorides; stabilizing additives like tributyl tin, which cause endocrine disruption; and dioxins including 2,3,7,8-tetrachlorodibenzo-p-dioxin, which cause adverse impacts on immunity depending on the concentrations (Jaakkola and Knight 2008, Rochman et al. 2019, Thornton 2002). Styrene, the monomer for PS, is of concern because it is a classified carcinogen (Rochman 2015). The PC monomer, bisphenol A (BPA), is in the California Office of Environmental Health Hazard Assessment’s (OEHHA) Proposition 65 list of female reproductive toxicants and developmental toxicants (CA OEHHA 2020). Biomonitoring California also listed BPA as an endocrine toxicant (CECBP 2019). Although the PC monomer BPA may have endocrine disruption effects (Rochman 2015), the most recent FDA risk assessment concluded that BPA is safe at the current levels occurring in foods. The available information continues to support the safety of BPA for the currently approved uses in food containers and packing (FDA 2018).
Recent efforts have been taken to reduce the use of additives, especially phthalates, polybrominated diphenyl ethers, cadmium, lead, and BPA, in plastics. However, it is possible these substances are present in older plastics (WHO 2019). Low molecular weight and some mid-range phthalates such as di-2-ethyl-hexyl phthalate and dibutyl phthalate have demonstrated potential endocrine-disrupting effects. However, higher molecular weight phthalates have been assessed by USEPA and Health Canada and have no demonstrated potential endocrine disrupting effects.
4.1.2 Adsorbed Chemicals
Hydrophobic interaction is the most common mechanism by which MP adsorb organic pollutants and control the portion of organic pollutants (Wang et al. 2018). MP can easily adsorb pollution in the environment because of their large specific surface area and strong hydrophobicity. Sorption is the process of transferring chemicals from fluids (liquids and gases) to solids (Fred-Ahmadu et al. 2020, Vieira et al. 2021) and includes adsorption and absorption. The sorption mechanisms between MP and chemicals depend on physical and chemical properties of MP, type of adsorbed chemicals, temperature, and solution chemistry (Wang et al. 2018). These parameters affect the amount of chemical adsorbed on MP, thus affecting the transfer of those chemicals in the environment and the food chain via MP (Wang et al. 2018).
MP present in surface water readily adsorb organic chemicals due to their hydrophobic nature, with the degree of hydrophobicity depending on their polymer type (Wang et al. 2018). Guan et al. (2022) showed in their studies that the aging time increased the oxygen content, specific surface area, and hydrophilicity of MP. The high surface area to volume ratio and hydrophobicity of MP contribute to the ability of MP to accumulate metals (for example, lead and cadmium) and persistent organic pollutants (POPs) such as polycyclic aromatic hydrocarbons (PAHs), polychlorinated biphenyls (PCBs), per- and polyfluoroalkyl substances (PFAS), and organochlorine pesticides such as dichlorodiphenyltrichloroethane (DDT) from marine water (Amelia et al. 2021, Scott et al. 2021).
MP may interact with environmentally persistent pollutants (for example, PAHs and metals) depending on the polymer physio-chemical properties (Teuten et al. 2009). Organic pollutants can adsorb to MP surfaces via hydrophobic, electrostatic, and non-covalent interactions (Joo et al. 2021, Lee, Shim, and Kwon 2014, Liu, Zhu, et al. 2019). Heavy metal adsorption to MP occurs through electrostatic interactions, van der Waals forces, and π–π interactions (Liu et al. 2021). Metals also interact with extracellular polymeric substances (metabolites secreted by microorganisms) from assemblages of microorganisms existing in biofilms that develop on MP surfaces (also discussed herein). The extent of metal adsorption to extracellular polymeric substances is a function of composition, functional group composition, and surface microstructure such as porosity or surface roughness (Liu et al. 2021).
The sorption and aggregation that occur between weathered MP and their co-existing constituents is influenced by the weathering rate of MP in the aquatic environment. The weathering process increases the oxygen-containing functional groups and the specific surface area of MP. More studies are needed to investigate the weathering processes of diverse MP under natural field conditions in soil, sediments, and aquatic environments to better understand the impact of weathered MP in the environment (Duan et al. 2021).
Degradation of the surface of MP and weakening of the plastic surface cause the release of microscopic particles and increase accessibility to microorganisms (Lambert, Scherer, and Wagner 2017). The increased capacity to adsorb harmful chemicals in smaller MP is attributed to higher surface area to volume ratios (Bergmann, Gutow, and Klages 2015, Rochman et al. 2019, Wang and Wang 2018a). Degradation of MP also enhances the sorption capacity to harmful chemicals due to increased surface area (Alimi et al. 2018). Compared to smooth MP, rough MP adsorb more chemicals such as DDT due to increased surface area from degradation. This results in increased sorption capacity (Alimi et al. 2018). These contaminants have a greater affinity for plastics than water; hence, the concentrations on MP are orders of magnitude greater than in the ambient water (Cole et al. 2011, Smith et al. 2018).
Color additives (that is, pigments), aging, UV weathering, discoloration, fouling, and polymer type may also affect chemical sorption capacity of MP (Alimi et al. 2018, Endo et al. 2005, Teuten et al. 2009, Wang et al. 2018). Discoloration of MP occurs with weathering and aging processes. Aged MP have higher sorption capacities of pollutants than do virgin ones (Guo and Wang 2019). Pigments contain organic chemicals from plants and animals that may enhance chemical sorption capacity of colored MP (Wang et al. 2018). Antunes et al. (2013) showed that aged and black MP pellets contained higher concentrations of PCBs and PAHs than colored and white ones. In addition, aged pellets contained higher DDT concentrations than others (Antunes et al. 2013). All pellets contained mainly PE and PP, but some black pellets also contained PUR, which is known to adsorb more contaminants than other polymer types due to its higher surface area (Antunes et al. 2013). Aged MP have longer exposure times and higher degradation rates than non-aged ones. The increased surface area and roughness result in increased chemical sorption capacity (Antunes et al. 2013, Wang et al. 2018).
4.2 Physical Properties
Polymer type affects the physical properties of MP, such as density, crystallinity, hydrophobicity, and porosity (Lambert, Scherer, and Wagner 2017, Wang et al. 2018). Crystallinity is the degree of structural order of polymer chains that make up the MP. Crystallinity affects the density and permeability of MP. The crystallinity of MP can change via degradation. Degradation in the amorphous region of MP increases its overall crystallinity and consequently influences other physical properties, such as surface area, shape, size, and density. Thus, the toxicity of degraded MP may differ from the parent MP (Lambert, Scherer, and Wagner 2017). Pore diameter and size of the additive and the pore size of the polymer determine the migration potential of an additive in a polymer. Smaller or lower molecular weight additives move more easily through a polymer that has a bigger pore size (Teuten et al. 2009).
The toxicity of MP is influenced by size (Bucci and Rochman 2022, Lambert, Scherer, and Wagner 2017). The toxicity of small MP is a particular concern because they can transfer between tissues and cells of organisms (Rochman et al. 2019). MP smaller than 10 µm can be inhaled by humans, and MP larger than 1 µm can be removed from the respiratory tract without reaching the lungs (Wright and Kelly 2017). MP less than 1 µm may translocate via diffusion and penetrate into lung tissues (Wright and Kelly 2017). A fish study showed that MP particles smaller than 130 µm may translocate between cells through diffusion (McIlwraith et al. 2021). Exposure to smaller MP that can penetrate through lipid membranes of cells causes the formation of a higher number of reactive oxygen species, which result in growth inhibition and behavior alteration in various aquatic organisms and mammals, such as rats and humans, through oxidative stress and inflammatory responses (Hu and Palić 2020). However, further mammalian model and epidemiological studies are needed to confirm these findings (Hu and Palić 2020). To date, these studies are limited, and laboratory conditions often do not reflect real-life environmental conditions. Although there are limited studies that showed translocation of MP, more research is needed in this area.
The shapes of MP affect the interactions within the biological systems (Lambert, Scherer, and Wagner 2017). MP particles with more irregular shapes or fibers may attach more readily to internal and external surfaces of organisms (Lambert, Scherer, and Wagner 2017). Many nonfiber MP are likely to sink due to their higher density than fibers (Miller, Hamann, and Kroon 2020). Therefore, bivalves that filter the water column are more likely to be exposed to fibers absorbed to the water column than to other shapes of MP that sink (Miller, Hamann, and Kroon 2020). In a recent study, ingestion of PE microfibers (700 µm in length, 10–15 µm in diameter) resulted in more oxygen consumption in juvenile Centropristis striata (black sea bass) than ingestion of PE microspheres (10–20 µm), which suggests microfibers cause more risk to the respiratory system in aquatic organisms than MP spheres (Stienbarger et al. 2021). In another recent study, 38% of the fish collected from San Francisco Bay, California, contained MP levels above laboratory blanks; the average number of MP ranged from 0.2 to 0.9 nonfiber MP per fish and 0.6 to 4.5 fiber MP per fish (Sutton et al. 2019). In this study, a total of 1,919 MP particles were counted in 152 fish gut samples. The distribution of MP in all fish gut samples was 1,650 fibers (86%), 192 fragments (10%), 74 films (3.9%), two foams (0.1%), and one sphere (0.05%) particle (Sutton et al. 2019). MP with spherical shapes were shown to cause less injury and gut inflammatory reaction than irregular shapes (Pirsaheb, Hossini, and Makhdoumi 2020). For instance, PP fibers, with a length of 20–75 µm and diameter of 20 µm, have a higher toxicity to the Hyalella azteca (an amphipod) than PP beads with a diameter of either 10 or 27 µm (Lambert, Scherer, and Wagner 2017). Sharp-edged and rough MP can cause more mechanical injuries to the gut epithelium in organisms than smooth ones (Kutralam-Muniasamy et al. 2020b).
4.3 Microplastics as Vectors
Concerns have been raised that unreacted residual monomers, chemical additives (for example, plasticizers, flame retardants, antioxidants, and pigments), processing aids, by-products, breakdown products, and contaminants present in plastics can be harmful to the environment and human health when they leach from the plastic polymer matrix (Smith et al. 2018, Wiesinger, Wang, and Hellweg 2021, Wright and Kelly 2017). The photolytic or mechanical degradation of macroplastics into MP may cause additives to leach out, thus introducing potentially harmful chemicals to biota (Cole et al. 2011). Plasticizers, other plastics additives, and constitutional monomers can leach from MP in waste disposal sites into groundwater and surface waters; thus, MP can serve as carriers of organic contaminants to wildlife (Teuten et al. 2009). For instance, BPA, phthalates, and alkylphenols such as nonylphenol and octylphenol in landfill leachate have been detected that can end up in the aquatic environment (Teuten et al. 2009). In addition, MP can serve as a substrate for microbial communities and can carry pathogenic and invasive species to non-native waters (Cole et al. 2011). Metal-based additives in plastics are mainly used as inert fillers, pigments for color, and stabilizers (Turner and Filella 2021).
Ingested MP have also been hypothesized as a vector for the transport of certain persistent pollutants. For instance, ingestion of MP fibers by the crab Carcinus maenas and lobster of the genus Nephrops formed fibrous aggregation within the gut and reduced egestion times. MP are more likely to transfer to their predators with increased residence time (Au et al. 2017). Shape and size influence MP residence time in prey species (Au et al. 2017, Gray and Weinstein 2017). Smaller MP can have longer gut retention and may be transferred from lower to higher trophic organisms through the food web (Gray and Weinstein 2017).
Kutralam-Muniasamy et al. (2020a) showed that organisms consume more aged MP than virgin MP. Moreover, many animal species are visual predators, and may select prey based on the color of MP (Carlin et al. 2020). Therefore, some animal species may selectively feed on MP that contain larger amounts of toxic chemicals (Carlin et al. 2020, Guo and Wang 2019, Kutralam-Muniasamy et al. 2020a).
PET is one of the most common of MP. Fiber and fragments resulting from degradation of larger items, such as synthetic clothing and fabrics, would release microfibers when worn and washed. PET is also widely used in packaging materials, beverage bottles, and functional material. The amount of PET that enters and accumulates in the ecosystem poses a significant environmental challenge (Gong et al. 2018). PET is suspected to leach endocrine-disrupting chemicals, depending on the product type (Lambert, Scherer, and Wagner 2017, Sax 2010).
A recent review of 61 studies evaluated the weight of evidence for the MP vector effect as generally weak (Koelmans, Diepens, and Mohamed Nor 2022). Laboratory and field studies often neglected environmentally relevant exposure conditions or were inconclusive with respect to causality (that is, did not address alternative yet reasonably complete exposure pathways). The more conclusive laboratory and field studies generally provided evidence for the absence of the vector effect. Modeling studies under environmentally realistic conditions suggest that MP may act as passive samplers (or sinks) in the gut that counteract the bioaccumulation mechanism. Thus, the available evidence does not support the assertion that MP play a major role in the bioaccumulation of POPs when compared to other exposure pathways under environmentally realistic conditions. However, concentrations of MP and associated chemicals ultimately determine the extent to which the presence of MP increases chemical exposure compared to a contaminated environment without plastic particles (Koelmans, Diepens, and Mohamed Nor 2022).
The large surface area to volume ratio and hydrophobic nature of MP also provide a suitable microenvironment for the formation of biofilms on the particle surface (Katyal, Kong, and Villanueva 2020). Biofilms consist of single or multiple species of microorganisms attached to a solid surface and encased in an extracellular polysaccharide matrix or extracellular polymeric substances (Bowley et al. 2021). Certain MP biofilms have been shown to exhibit selective enrichment of bacterial pathogens, including antibiotic-resistant bacteria (Galafassi et al. 2021, Laverty et al. 2020, Oberbeckmann, Löder, and Labrenz 2015, Oberbeckmann et al. 2014, Sathicq et al. 2021, Yang et al. 2020). Although MP can serve as a vector for pathogens, it remains uncertain whether the increasing number of MP in aquatic habitats facilitates pathogen transmittal and increases the potential for disease outbreaks (Bowley et al. 2021).
4.4 Trophic Transfer
Trophic transfer is a process of indirect exposure wherein humans or wildlife predators consume an organism that has retained MP. MP have been shown to occur in 800 species encompassing all trophic levels (primary consumers, herbivores, predators) and habitats—for example, in marine coastal seagrass, reefs, and open water (Akhbarizadeh et al. 2020, BfR 2020, Chatterjee and Sharma 2019, EFSA Panel on Contaminants in the Food Chain 2016, GESAMP 2016, Li et al. 2019, Sharma et al. 2021, Mercogliano et al. 2020, Smith et al. 2018, GESAMP 2015). Food webs consist of a network of trophic interactions that could elucidate ecosystem processes and functions. However, the presence of unknown but critical networks hampers the understanding of complex and dynamic food webs in nature. Kuwae et al. (2012) demonstrated that direct predator-prey relationships between shorebirds and biofilm are mediated by multiple ecological and evolutionary determinants. A major impediment in determining food web structure stems from the difficulty in identifying interspecific links. In general, the discovery of new interactions in networks derives from extensive empirical studies (Bascompte 2010). Kuwae et al. (2012) empirically showed that a missing and critical trophic link does exist by exposing extensive predator-prey relationships between shorebirds (waders) and biofilm. The strength of this missing link is differentially mediated by predator species traits, the environment that determines node properties (food density) and evolutionary history (phylogenetic constraints).
Lower trophic–level filter feeders ingest MP particles that are mistaken for food due to their similar characteristics, such as size, color, buoyancy, and density (Akhbarizadeh et al. 2020, Chatterjee and Sharma 2019, Lusher, Hollman, and Mendoza-Hill 2017, Sharma et al. 2021). These include plankton (Laist 1987), zooplankton (Cole et al. 2013, Lee et al. 2013, Lin 2016), amphipods (Au et al. 2015, Straub, Hirsch, and Burkhardt-Holm 2017), bivalves (Farrell and Nelson 2013, Van Cauwenberghe and Janssen 2014, Wright, Thompson, and Galloway 2013), marine worm (Besseling et al. 2013), crab (Brennecke et al. 2015, Farrell and Nelson 2013), and planktivorous or larval fish (Besseling et al. 2013, Critchell and Hoogenboom 2018, Lu et al. 2016, Pedà et al. 2016, Steer et al. 2017). Additional work shows that some larval fish ingest the majority of plastic via trophic transfer (Athey et al. 2020, Hasegawa and Nakaoka 2021, Stienbarger et al. 2021). MP content in upper trophic–level vertebrates (predatory fish, sea birds, and mammals) demonstrates trophic transfer because they are unlikely to confuse their prey and plastic (Azzarello and VanVleet 1987, Mattsson, Hansson, and Cedervall 2015, Sharma et al. 2021). Trophic transfer of MP can also occur when prey has MP externally adsorbed to appendages (Cole et al. 2013, Gutow et al. 2015, Setälä et al. 2018).
There have been concerns about biomagnification or concentrating MP in higher trophic–level organisms as a result of ingesting other plants or animals. However, quantitative studies showing biomagnification of MP and the health implications for humans (Derraik 2002, McIlwraith et al. 2021, Moore 2008, Setälä et al. 2018, Teuten et al. 2009) do not indicate clear evidence of biomagnification (Gouin 2020).
Bioaccumulation is the net accumulation of a chemical by an organism resulting from uptake via all routes of exposure (sediment, water, and food). Traditional assessments use the information from bioaccumulation laboratory studies to generate a bioconcentration factor (BCF), which is the ratio of the steady-state chemical concentration in an aquatic organism and the water. For MP, bioaccumulation would represent accumulation of MP within the tissues of an organism that exceeds the concentration of such particles in the surrounding environment.
Mackay and Fraser (2000) published a review that presented the bioaccumulation of organic substances in organisms, especially fish. Based on a review of existing estimation methods, a tiered predictive approach was developed for addressing the large number of chemicals of commerce. The simplest Tier 1 approach is an empirical correlation for BCF as a function of the octanol–water partition coefficient. The Tier 2 evaluation predicts the bioaccumulation factor by using a mechanistic mass balance model applied to the organism at steady state in which relevant uptake and loss processes are quantified. The equivalence of rate constant and fugacity models is demonstrated and methods of obtaining parameter values are discussed. Such a model reveals the relative significance of gill ventilation, food uptake, egestion, and metabolism. The most detailed Tier 3 evaluation involves prediction of the potential for biomagnification in a food chain involving both fish and air-breathing animals (Mackay and Fraser 2000).
However, due to analytical and methodological issues, there have been very few, if any, laboratory studies conducted on the bioaccumulation of MP particles in higher organisms such as fish. To more fully address the issue of bioaccumulation and trophic transfer, Gouin (2020) reviewed over 800 publications reporting the presence of MP in fish. The review included data for >900 species representing ~ 87,000 individual organisms. MP (and macroplastic debris) were observed in about 17,500 or 20%. On average, there were 4 particles reported per individual organism across all studies reviewed.
Although fish muscle is the most frequently consumed fish tissue for humans, other tissues (gill, liver, gut) are more frequently analyzed because these are more likely repositories for contaminants (Akhbarizadeh, Moore, and Keshavarzi 2018). Fish and seafood, particularly those consumed whole (for example, canned sardines), represent some of the most important routes of MP exposure for humans through the diet (Akhbarizadeh, Moore, and Keshavarzi 2018, GESAMP 2015, 2016, Karami et al. 2018, Lusher, Hollman, and Mendoza-Hill 2017, Mercogliano et al. 2020, Smith et al. 2018, Yang, Yang, et al. 2015).
Physical properties of MP (for example, size and shape) can influence not only uptake, but also retention duration in biota (Ašmonaitė and Almroth 2019). More research is needed to understand the biological fate of plastic particles in an organism following uptake in the digestive tract—translocation (to the circulatory system or surrounding tissue), accumulation (retention), and elimination (egestion) (Browne et al. 2008, Lusher, Hollman, and Mendoza-Hill 2017). Most investigations pertain to the presence of MP in the gut tissue of human food items. Elimination is the dominant fate pathway; likely greater than 90% of MP accumulated in humans are excreted in feces (Liebmann et al. 2018, Schwabl et al. 2019, Smith et al. 2018).
In addition to trophic transfer of the MP particles, there may be other co-occurring contaminants that could also transfer (Mercogliano et al. 2020). Laboratory data demonstrated that trophic transfer of POPs associated with MP does occur from brine shrimp (Artemia nauplii) to zebrafish (Danio rerio) (Athey et al. 2020, Batel et al. 2016, Hasegawa and Nakaoka 2021). According to Athey et al. (2020), Batel et al. (2016), Hasegawa and Nakaoka (2021), Lusher, Hollman, and Mendoza-Hill (2017) these contaminants would represent less than 0.1% of the total dietary intake. Trophic transfer across terrestrial systems has not been well studied. Studies have shown the impact of MP and chemicals associated with MP on plants; however, there is uncertainty as to whether plants take up MP into the edible parts. A study by (Wang et al. 2022) showed that phthalate acid esters associated with plastics and MP were absorbed by roots and transferred to leaves. This data gap on trophic transfer of MP in terrestrial systems should be explored to further understand transport pathways of MP into food sources for both humans and wildlife (Figure 4-2).

Figure 4-2. MP from primary and secondary sources enter the food chain at all trophic levels.
Source: Modified from Issac and Kandasubramanian (2021)
4.5 Human Health
As with all contaminants, the type and extent of MP toxicity will be directly influenced by the degree of exposure (dose and duration) from the pathways and routes described. As discussed in Section 4.1, MP characteristics such as size, density, composition, hydrophobicity, and surface charge influence the uptake, absorption, and distribution of MP within the human body, thereby directly influencing potential adverse health exposures and effects. Potential exposures and impacts of MP to human health are increasingly being considered by expert panels, for example USEPA (2015), European Commission (2019) and NASEM (2021). As described in the following sections, other panels and regulatory bodies have focused on food as a source of exposure.
4.5.1 Potential Human Exposures
Humans are known to be exposed to MP from a variety of sources, with a growing number of attempts to quantify intake. Humans can be exposed through ingestion, inhalation, and dermal absorption, with primary exposures through inhalation of airborne particles and ingestion of contaminated food (Mohamed Nor et al. 2021). There is less evidence of systemic exposure through skin contact. Mohamed Nor et al. (2021) developed a probabilistic model to estimate the global MP intake per capita per day through inhalation and ingestion of each of eight foods (fish, mollusks, crustaceans, tap water, bottled water, beer, milk, and salt) for which MP concentrations were available. The MP intake distribution was very broad. Median intake for inhalation and all eight foods was 1.8 x 10⁻⁴ and 5.8 x 10⁻⁴ mg per capita per day for children and adults, respectively. Mohamed Nor et al. (2021) noted that this is far less than the dietary intakes of other types of nano- and microparticles, such as titanium dioxide and silicates, that were estimated by Powell et al. (2010) to be about 40 mg/capita/day in the United Kingdom. Mohamed Nor et al. (2021) also simulated transfer of a relevant suite of chemicals from ingested MP via kinetic modeling. The results showed that the contribution of ingested MP to total chemical intake would not substantially affect the background chemical concentration in the gut originating from food. Other studies attempting to provide an overview of MP exposures from multiple sources have focused on dietary exposures (Jin et al. 2021, Pironti et al. 2021) or MP output in feces (Braun et al. 2021, Yan et al. 2022).
Another line of research includes studies that have reported on the presence of MP in various tissues in humans, including placenta (Ragusa et al. 2021), liver (Horvatits et al. 2022), and breast milk (Ragusa et al. 2022). Pulmonary translocation to systemic circulation has been demonstrated for fine and ultrafine particles (Elder and Oberdörster 2006, Peters et al. 2006).

