3 Sampling and analysis
Although MP in the environment have been a concern for many years, techniques and best practices for sample collection and analysis of these particles and fibers are still very much evolving. To date, few standard methods have been adopted, and currently there are no regulations governing levels of MP, although there are draft requirements for testing and reporting MP in drinking water in California.
- In 2020, ASTM International (ASTM) adopted two standards: one for water sample collection (ASTM 2020a), and the other for water sample preparation (ASTM 2020b), which covers low, medium, and high ranges of suspended solids.
- California State Water Board adopted Raman and FTIR methods for MP identification in drinking water (CA SWRCB 2021b, a).
Select a red dot in Figure 3-1 to find out more about sampling methods in various environmental media.

Groundwater/Drinking Water
Section 3.4.1.1-sample collection
Section 3.6.1.1-sample preparation
Drinking Water
Section 3.4.1.5-sample collection
Section 3.6.1.1-sample preparation
Surface Water - Freshwater
Section 3.4.1.2.1-sample collection
Section 3.6.1.2-sample preparation
Sediment
Section 3.4.2.2-sample collection
Section 3.6.2-sample preparation
Pore Water
Section 3.4.2.3 sample collection
Section 3.6.1.2-sample preparation
Figure 3-1. Conceptual model for sampling methods.
Source: Jonathan McDonald and the ITRC MP team.
It is the goal of this section to outline the most common techniques and best practices for sampling and analyzing MP (Figure 3-2); however, this section is not intended to represent technical standard operating procedures (SOPs). References included and future documents may detail SOPs and procedures. Nanoplastics (NP) will be referenced as appropriate because many of the same techniques apply, but details specifically regarding NP may need to be included in a separate document. Although many compounds and chemicals are known to adsorb to MP, this section will not address them because the techniques are more appropriately covered in established techniques specific to those compounds and chemicals.
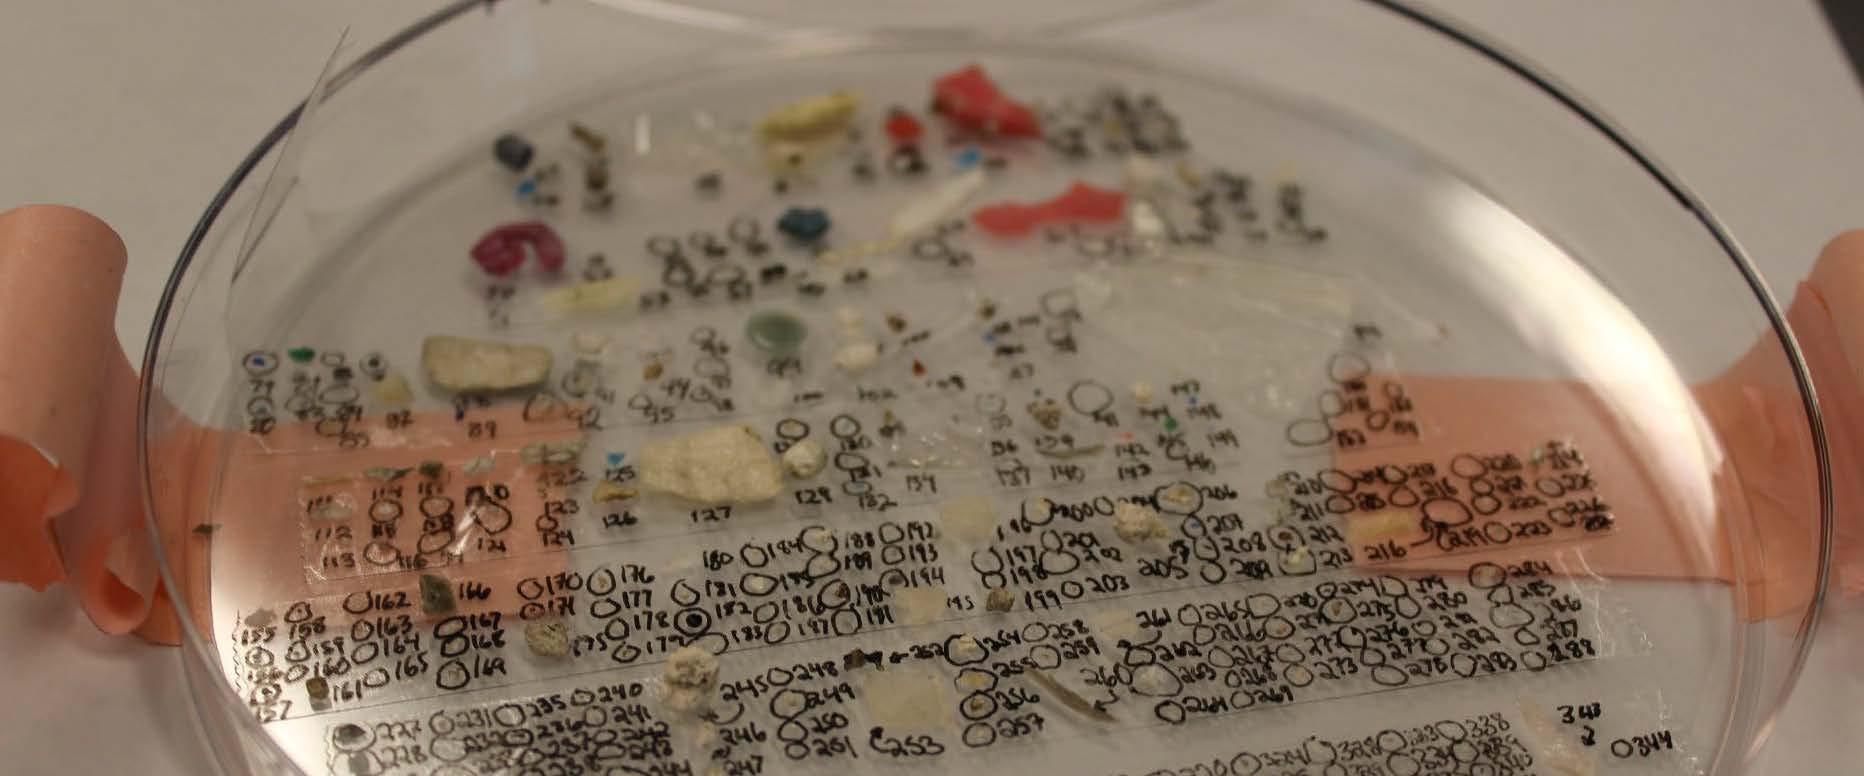
Figure 3-2. Example of a subset of microplastics collected from a single experiment. The large end of the MP scale is visible to the naked eye.
Source: Rochman Lab via the California Ocean Protection Council.
3.1 Sample Collection Considerations—MP
3.1.1 General Sampling Considerations
Study questions for monitoring purposes should be identified, and the methods chosen should be compatible with study objectives. Publications on appropriate study data quality objectives (DQOs) exist (USEPA 2006). DQOs could include:
- identification and determination of mass of MP
- identification of particle number, size, and shape of MP
- characterization of specific properties of individual MP particles
- polymer type
For general monitoring, targeted size ranges should be defined by programmatic needs, understanding that the smaller sizes are more difficult to sample, extract, and identify.
3.1.2 Filtration
Sieve and filter sizes should be chosen in accordance with DQOs appropriate for the experimental design. For example, if the experimental design is to collect particles that may be ingested by filter-feeding organisms with uptake between 50 and 100 µm, a series of sieves and filters that removes particles greater than 150 µm and captures particles greater than 40 µm may be appropriate. Also consider that the smaller the sieve or filter size, the more rapidly it clogs; therefore, there may be a need to balance the sieve size with the volume that is filtered, or to plan for multiple filters from one sample.
3.1.3 Volume
Several factors need to be considered when determining desired sample volume: matrix; if water, the type of water (tap, river, lake, groundwater, etc.); location (rural versus urban); and expected general concentration of MP particles and other particles that may clog filters. A sample volume that is too large can result in the collection of too many particles, which can clog filters and sieves. Sample volumes that are too small reduce the chances of detecting particles and can result in loss of statistical power (Koelmans et al. 2019). ASTM publications include volume considerations for high, medium, or low concentrations of suspended solids and have been validated for the collection of samples from drinking water, surface waters, wastewater influent and effluent (secondary and tertiary), and marine waters (ASTM 2020b). Analytical subsample volumes will be discussed in the appropriate analytical sections.
3.2 General Quality Assurance/Quality Control
Quality assurance and quality control (QA/QC) are particularly important considerations for MP research and analyses because the likelihood of contamination, including cross-contamination, is high. This high potential for contamination results from the ubiquitous presence of plastics and MP introduced through a variety of products, materials, and sources (Gwinnett and Miller 2021). The potential contamination can be appropriately addressed through special considerations for collection and processing of samples, as described in Section 3.2.2.
General good laboratory practices, such as the maintenance of a clean lab bench and equipment, initial and ongoing staff training, proper chain of custody of samples, frequent instrument calibration, etc., are all foundational aspects to reliable MP analysis. Sample bottles should be rinsed with reagent water prior to sampling. Plastic sampling materials should be avoided where possible (Koelmans et al. 2019). Because of the inherent use of plastics in our daily lives, results from studies without explicit QA/QC planning are likely to not be useful due to contamination of samples and equipment. Though a standardized method does not yet exist, a highly cited MPs reporting guidelines checklist has been published in Cowger et al. (2020).
3.2.1 Collection of and Processing of Blanks
One of the most important and valuable steps to track and minimize contamination is the use of blanks in sample collection and processing. Blanks are samples that undergo all manipulations and contain all reagents experienced by a typical sample but contain no sample matrix. They are designed to determine whether contamination of a sample occurs during processing in either the field or lab. During collection, field blanks should be taken at each site or during each day of collection at a minimum. Field blanks consist of an empty or reagent water (Milli-Q or filtered DI)-filled sampling container that follows the same collection procedures as samples and can be used to document the contribution of contaminating materials to overall counts. Laboratory blanks should be employed during sample processing by subjecting reagent water or a clean or known reference material to the same processing steps as the rest of the samples. For both field and laboratory air blanks, the blank sample is opened when the sample is exposed to the air and closed when the sample is not exposed to the air. As a standard practice, laboratory blanks are recommended for every batch of 10–20 samples. Additional blanks to track general laboratory contamination can be made by placing wetted filters in glass petri dishes or empty or reagent water-filled glass beakers on common laboratory surfaces.
There are several options to process the contaminating particles from blanks, but no standard approach (Brander et al. 2020, Bråte et al. 2018, Miller et al. 2021) Blank results should be reported separately from sample results. Subtraction of blank results may be performed, but this is not always straightforward, as blank particles do not always match sample particles (Baechler et al. 2020, Harris et al. 2022). If particles found on blanks match those in a sample, they can be subtracted from samples processed during the same batch by their shape and color. For example, if four blue fibers are found in the blank, a maximum four blue fibers are then subtracted from all samples processed in that batch. Alternatively, particle counts from blanks can be provided in study information and any samples that contain counts lower than those found in blanks should be considered “non-detects.” Regardless of whether researchers choose to blank subtract samples, field and method blank data should be explicitly reported so that blank contamination may be tracked. Data validation approaches for interpreting blank results and qualifying data based on blanks should be determined prior to sampling and documented in the work plan (USEPA 2006).
For water samples, the sensitivity and limit of detection will be affected by the volume of water sample collected or filtered. The specific sample preparation options and analysis techniques also affect the overall sensitivity. Matching the sensitivity of the measurement process to what is necessary for decision-making rather than automatically selecting the most sensitive option in all instances is generally recommended.
3.2.2 Special Considerations for Collection and Processing Samples
Several considerations should be addressed when analyzing for MP. Though a standardized method does not yet exist, a highly cited MP reporting guidelines checklist has been published and is available in Cowger et al. (2020).
3.2.2.1 Clothing
Fibers shed from clothing can be a significant source of MP and contribute to sample contamination (Scopetani et al. 2020). Staff conducting sampling, processing, and analysis for MP studies should avoid clothing made from synthetic textile materials (for example, polyester, acrylic, spandex, etc.) in favor of natural materials such as cotton, hemp, and wool. Clothing policies may also require a specific color of clothing or lab coats to better track and deal with sources of contaminating fibers. In the laboratory, cotton lab coats will help to reduce plastic fiber emission from any semisynthetic or synthetic clothes and minimize high blank values. Nitrile or latex gloves are also recommended for laboratory processing, although care should be taken to replace gloves frequently and make note of gloves that degrade and shed. If contamination is significant, additional steps can be taken, such as the use of a lint roller to capture shedding fibers, or the use of sticky tape or a sticky mat in the laboratory entrances and exits to minimize MP or fiber travel (Brander et al. 2020).
3.2.2.2 Air Handling Systems
To minimize the transport and contribution of contaminating fibers throughout the laboratory, air circulation should be controlled as much as possible. Laboratories should ideally be outfitted or retrofitted with air handling systems with HEPA (high-efficiency particulate absorbing) air filters to reduce the transport and deposition of fibers onto laboratory surfaces. However, studies have also shown that the simple use of a fume hood when processing samples for MP analyses can minimize contamination by as much as 50%, while the use of a clean hood or laminar flow hood can reduce contamination by up to 97% (Wesch et al. 2017).
3.2.2.3 Filtration of Liquid Reagents, Including Processing Water
All processing water and reagents used for sample processing should be tested for contamination or directly filtered and kept in clean storage containers. Glass fiber filters are helpful for filtering bulk solutions as they do not clog easily and do not contribute to sample contamination. However, other filter types, such as cellulose or filters that do not interfere with analytical measurements, may also be used. Solutions should generally be filtered using 0.45 µm or 1 µm filter pore sizes. Larger pore sizes may be used provided they are smaller than the MP particle size thresholds proposed for use in the study.
3.2.2.4 Equipment and Supplies
Avoid the use of equipment and supplies made of plastic materials to collect, process, and analyze samples for MP. For example, samples should be collected into glass containers, using metal piping when possible, and processed using glass and metal equipment and supplies. If DQO include biological hazards, autoclaving of glass equipment can be performed to prevent contamination. When this is not possible, researchers should consider collecting portions of the supplies used, such as plastic tubing or plastic containers, and archiving them for possible confirmatory analysis in the event these materials appear to result in unforeseen contamination.
All sampling and processing supplies and equipment should be washed well with laboratory detergent and hot water, followed by triple rinses with reagent-grade water. Glassware that has been used for extensive processing may also be baked at high temperature to off-gas any remaining plastic residues. Glassware and other supplies should be kept in closed cabinets or upside down when not in use and should be covered by aluminum foil during sample processing.
3.2.2.5 Other Considerations
Special consideration should be taken for any materials in the laboratory or field that may contribute to contamination, such as the fibers from office chairs, old or disintegrating lab supplies or tubing, microscope covers, etc. Care should be taken to avoid or document the use of cleaning supplies used, such as wipes or terry towels, as these may leave fibers on surfaces that may interfere with analysis. Several considerations taken into account when designing and maintaining a laboratory for the analysis of MP are shown in Figure 3-3.
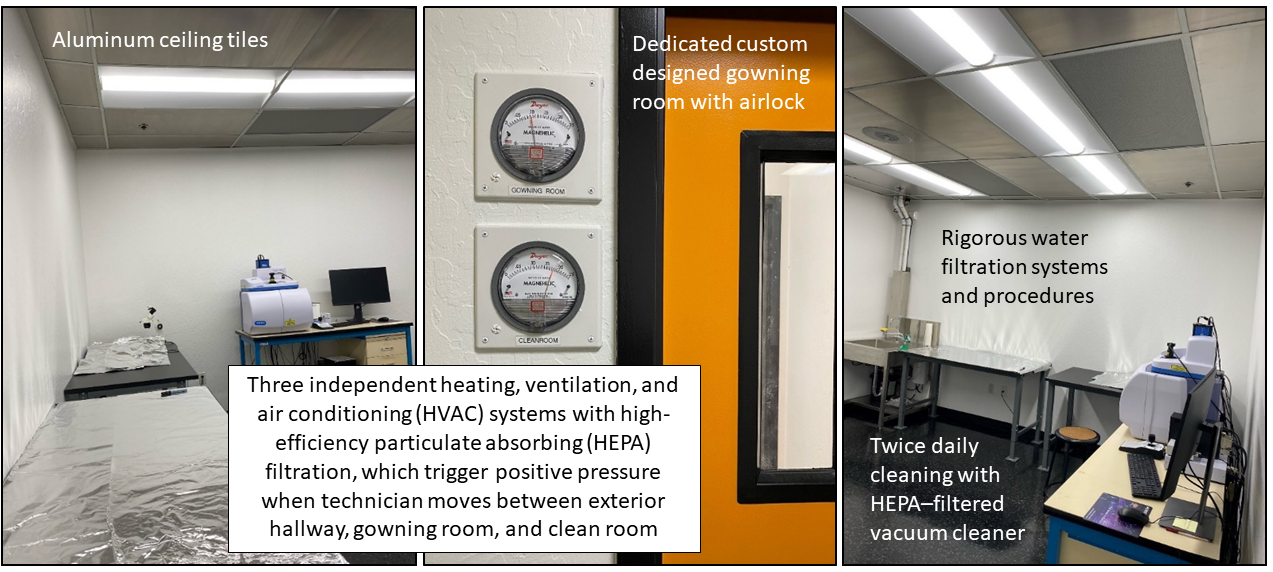
Figure 3-3. Considerations for laboratories analyzing for microplastics in samples.
Source: Eurofins Environment Testing
3.2.3 Standardization/Consistency
A universally standardized method of reporting results of MP laboratory analyses does not currently exist. This is partially due to the emerging nature of the MP pollution field but also due to the wide range of physical and chemical impacts that MP can have, which result in varying reporting goals. MP can be quantified in mass or count, depending upon project goals. It is recommended that sufficient information be provided in reports so that conversion to other commonly used units can be performed. Though a standardized method does not yet exist, a highly cited MP reporting guidelines checklist has been published and is available in Cowger et al. (2020).
3.2.3.1 MP Concentration Units
Miller et al. (2021) recommended providing particle counts rather than, or in addition to, total mass. It is yet unknown how particle shape and size affect toxicity. Current analytical methods generally lend themselves to counts, and this is the form in which most of MP data currently exist. Particle counts allow descriptors of shape and size, which more easily allow calculation of concentrations of specific types of particles, and are therefore easier to link to toxicity studies (Miller et al. 2021). When possible, report the actual size of particles rather than binning particles into size classes, as this allows for conversion to a hypothetical polydisperse mixture for modeling purposes (Koelmans et al. 2020). Reporting the actual size of the particles decreases the uncertainty in modeling sizes within binned classes for risk assessment.
Conversely, one advantage of using mass per volume (for example, µg/L for water) or mass per unit dry weight (for example, mg/kg for solids) for reporting is that these concentration units are commonly used for other contaminants in regulatory, monitoring, and toxicological programs (possibly except for engineered nanoparticles). As the most common unit of measure for contaminants, it would be useful to be able to consider MP in the same context. Volume and mass of sediment or soil samples may also contain a large proportion of water, so they should be described as wet or dry and preferably include a wet: dry ratio if given in wet weight. In addition, pyrolysis–gas chromatography–mass spectrometry (GC/MS) is increasingly used to identify and quantify small MP and NPs. This instrument reports MP in concentration (mass), not particle counts.
Additionally, a new paper published by the Southern California Coastal Water Research Project (SCCWRP) workshop series suggested including count and mass data as well as information regarding hazard characterization (SCCWRP 2021).
3.2.4 Documentation of the Sampled Environmental Matrix Amount, Prepared Laboratory Sample, and the Analyzed Sample
Documentation of the mass or volume of the sampled environmental matrix should be recorded. A documented trail of subsamples for extraction and analysis of the sample should be maintained to allow the quantity of MP in the analyzed sample to be related to the quantity of MP in the field sample.
3.2.5 Classification of MP into Size Classes
Nomenclature for size classes of MP is not yet standardized. The use of different units hampers comparability. Common size classes include macro, meso, micro, and nano, and these classes should be defined when first used (Campanale et al. 2020, Cowger et al. 2020).
3.3 Special Considerations for NP
We define NP as a subclass of MP particles with sizes ranging from 1 nm to 1,000 nm. Particles in this subclass have a host of analytical and sampling challenges associated with them given their extremely small size. First and foremost, it is key to understand that some polymer types have different properties within the smaller nanoscale (1–100 nm) than at larger sizes. For example, PE at a certain size threshold will become more wax-like than plastic-like. This is not surprising as a large component of paraffin wax (a primary constituent in candles) is a hydrocarbon polymer chain about 4 nm in length with a similar composition to PE (that is, C31H64). Further, because polymers at this size often lack highly crystalline structures, it is hypothesized that these particles may be more susceptible to biodegradation. Crystallinity in larger MP prevents bacteria and other smaller organisms from degrading the polymeric structure because the MP are simply too large and inflexible to be accommodated within degradative enzyme active sites; this may not be the case for NPs, however.
Methods to isolate and identify NP from environmental samples have not yet been validated (Koelmans, Besseling, and Shim 2015). Flotation and sieving methods traditionally used to separate MP from environmental media may encounter problems of agglomeration, low buoyancy, and adhesion to filter screens (Gigault et al. 2021). Research into new methods for isolating NP is ongoing—leading candidates for isolation include active density separation (centrifugation), field flow fractionation, flow cytometry, and electrostatic methods (Cai et al. 2021, Chen et al. 2022). Likewise, existing identification techniques have limited applicability for NPs. Infrared and Raman spectroscopy, the two most common methods for MP analysis, cannot resolve nanoscale particles because the wavelength of light used in these studies is larger than the particles themselves (Xu, Ou, et al. 2022). Moreover, practical considerations for these methods limit their application to particles 10 µm and larger. Pyrolysis-GC/MS may be used to identify plastic polymers if used in combination with digestion and ultrafiltration steps; however, these methods are not fully developed (Xu, Ou, et al. 2022). Scanning electron microscopy (SEM) has been used by scientists to detect NP in controlled conditions, particularly for known plastic samples that do not need to be separated from additional organic or inorganic matter. SEM is useful because it allows for detection of small particles and provides information on morphology and to some extent location (Zhou et al. 2006). However, resin identification is not possible as SEM can only identify elemental composition and not how the atoms are arranged in molecular bonds, which is required to accurately identify polymer resin types. Research into new methods to circumvent these problems is ongoing—it may be possible to adopt laser ablation techniques, such as matrix-assisted laser desorption/ionization (MALDI), coupled with mass spectrometry, to identify NP (Zhou et al. 2006).
Despite these challenges, the study of NP remains an important active analytical research topic as nano-sized particles can cross cellular membranes and potentially be implicated in both human health and ecological effects.
3.4 Sample Collection Methods by Matrix
This section includes subsections for sample collection methods by matrix. If applicable, both standard methods (for example, ASTM) and other newer methods or methods that may have limitations are provided.
The Sample Collection Tool aids the user in the selection of MP sample collection methods appropriate for the desired study. This tool allows the user to filter by sample matrix and particle size fractions. The tool outputs the available MP sample methods based on the selected inputs and provides additional details, such as equipment needed, advantages and disadvantages, relative cost, and references for additional information.
3.4.1 Water
In 2020, ASTM released the first standard practice for the collection of water samples with high, medium, or low suspended solids for identification and quantification of MP particles and fibers (ASTM D8332-20, ASTM 2020a). This method has been accepted for drinking water, surface waters, wastewater influent and effluent, and marine waters. Briefly, it consists of diverting a large volume of flow (400–1,400 gallons) via a pump or existing sample tap through a series of sieves with increasingly smaller mesh size. This method may also be further modified to apply to additional water matrices through additional validation and testing. Studies have suggested that in-line filtration is the ideal MP sample collection method for water due to the reduced potential for cross-contamination and the consistent, representative results it provides (Yuan et al. 2022).
3.4.1.1 Groundwater
No guidelines or best practices currently exist for collecting groundwater samples for MP analysis. Because collecting groundwater samples will most likely involve a permanent monitoring well made of plastic material (often PVC) and the sample will come in contact with plastic materials (tubing), it will be important to incorporate MP-specific QA/QC protocols, such as the inclusion of equipment blanks.
Special attention should be given to filter size when sampling wells. The filter size must be smaller than the slots in the well screen. Larger MP particles will be filtered out by the well screen prior to sample collection.
3.4.1.2. Surface Water
Standard collection processes for MP in surface water samples range from basic to sophisticated and generally include the following: manually filling sample containers by submerging in surface water body, filtration through a net or sieve, or collection via a pump. Following collection, the samples can be filtered in the field to collect particles within a specified size range. Depending on the specific collection method used, various sampling conditions (for example, sampling equipment, collection duration, water flow rate, depth of sample, etc.) should be recorded.
There are three primary sampling strategies for aquatic sampling: selective, bulk, and volume-reduced (Hidalgo-Ruz et al. 2012, Wang and Wang 2018b). Selective sampling methods are more applicable for MP that are visible to the naked eye. Bulk sampling involves analyzing the entire sample without volume reducing. Volume-reduced sampling reduces the entire volume of a bulk sample via filtration and saving only a small fraction of this sample for further analysis. Wang and Wang (2018b) provided details on the pros and cons of each sampling strategy.
As with other constituents, it is important to consider sampling objectives and site environmental factors when selecting an appropriate sampling method. For example, wind and waves can affect the distribution of MP. The size, shape, and density of MP, as well as the flow rate and flow profile, can also affect the distribution within the water column. Brander et al. (2020) and Miller et al. (2021) provided additional considerations when planning a sampling event. Common surface water sampling methods, applicable to freshwater and marine environments, include nets (Manta trawls and Neuston nets, Figure 3-4), grab samples, and auto samplers. Surface water sampling may also be automated using drone samplers (Norwegian University of Science and Technology 2022).
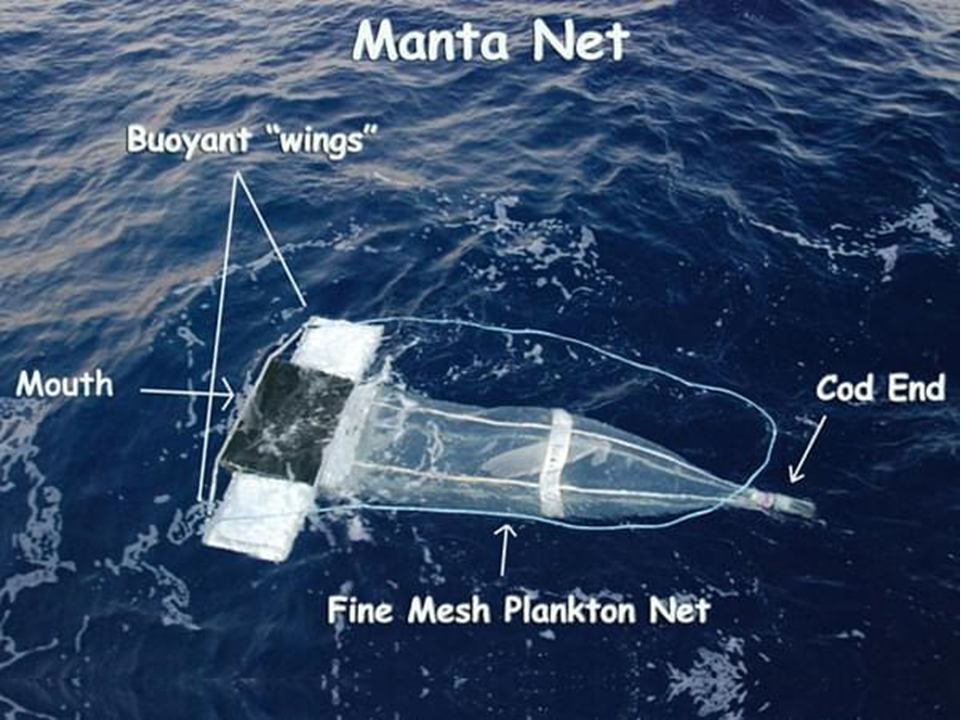
Figure 3-4. Photo of a deployed Manta net useful in trapping microplastics particles of a certain size.
Source: National Oceanic and Atmospheric Administration.
The following provides a brief summary of each method, compiled from Brander et al. (2020) and Miller et al. (2021):
- Manta trawls, Neuston nets, and Bongo nets ▼Read more
- Grab samples ▼Read more
- Pump/autosampler ▼Read more
Guidelines for recommended sampling volumes are set in Koelmans et al. (2019). The recommended sampling volume is at least 500 liters for surface water with 0.001-10 particles/L, with larger volumes recommended for remote areas.
3.4.1.2.1 Freshwater systems—rivers, streams, lakes, ponds, wetlands
Depth-integrated sampling may be the best method for a representative bulk sample in streams (Brander et al. 2020). However, this may depend on the DQOs. If the DQO is to evaluate ecological risk to a specific organism, then collecting a sample at the specific depth associated with the organism’s habitat may be prudent.
3.4.1.2.2 Marine systems—bays, estuaries, open ocean
Marine systems cover approximately 70% of the earth’s surface. They are arguably the most affected and most studied ecosystems with respect to MP. As marine systems are vast and encompass diverse environments, a single method cannot be proscribed for marine sampling. Instead, marine sampling designs must encompass the DQO determined for each study. Generally open ocean sampling designs should consider depth, stratification, currents, mixing layers, and turbulence. Coastal areas should consider the aforementioned factors, as well as the unique circulation patterns of bays and estuaries, freshwater inflows, and anthropogenic inputs unique to the study area.
3.4.1.3 Stormwater Runoff
While discharge is occurring, a sample should be collected from the center of flow of the outlet or from within the stormwater system by submerging the sample container beneath the water level, allowing water to enter directly into the bottle. Depending on the desired DQOs, a time-integrated sample collected across the duration of the storm event could be gathered. Various sampling conditions (for example, precipitation event intensity, presence of floating/suspended/settled solids, etc.) should be recorded.
3.4.1.4 Wastewater
Wastewater samples from influents to polished effluents can either be collected using the ASTM D8332-20 standard method (ASTM 2020a), or other common methods, such as those detailed in Sun et al. (2019). Overall, samples should be collected to maximize stream representativeness and to reduce the variability associated with wastewater; this includes targeting large sample volumes (for example, >1,000 liters) and sampling over a 24-hr flow cycle when feasible. Regardless, collection processes for MP in wastewater samples will depend on the targeted wastewater treatment step and monitoring or research goals.
For treatment process steps with flowing wastewater, permanent or temporary sampling equipment (for example, a submersible pump or autosampler set to deliver sampled water onto a series of stainless-steel sieves) can be installed within the wastewater body. For pressurized wastewater basins, existing sampling taps can be accessed to deliver flow toward a series of sieves. For stagnant wastewater bodies or treatment areas where it is difficult to establish sampling equipment, grab samples can be collected by submerging sampling equipment (for example, telescopic sampling pole, stainless-steel buckets, sample container) directly into the surface of the wastewater body. To provide data that is time-integrated and temporally representative, grab sampling can be conducted at select time intervals to provide a more representative distribution of MP concentrations. If desired, these collected samples can be filtered in the field through a series of stainless-steel sieves. Various sampling conditions (for example, specific sampling equipment, sieve fraction sizes, collection duration, water flow rate, depth of sample, etc.) should be recorded. It is also important to collect other significant wastewater characteristics that might influence MP removal and abundance, including specific treatment technologies used, total suspended solids, and volume treated, etc. (Habib, Thiemann, and Al Kendi 2020, Sun et al. 2019).
3.4.1.5 Drinking Water
Drinking water samples collected from a tap or bottled water can be sieved or filtered at the source. Screens should be removed, and taps should be flushed prior to sampling to avoid potential accumulation in the system. In-line filtration methods where water is filtered on site are emerging as a collection method due to the ability to sample large volumes of water on site and reduce the potential for airborne contamination of the water sample (Yuan et al. 2022). Any treatment of finished drinking water should be noted, as treatment type may alter MP concentrations. Drinking water source type and flow rate, in the case of tap water, should be recorded at the time of sample collection (Koelmans et al. 2019). If the DQO is to assess the treatment effectiveness, it is recommended that samples are taken at both raw/source and finished drinking water taps.
Due to the rapid development of MP studies and literature, recent guidelines developed just a few years prior regarding suggested drinking water sample volumes—for example, 0.5–2 liters by Smith et al. (2019) or 10 liters for bottled water by Koelmans et al. (2019)—are already considered to be outdated. Current guidelines recommend a sample volume of at least 1,000 liters for drinking water monitoring activities (Coffin 2022).
3.4.2 Solids
Solid matrices often integrate environmental conditions over time. Both freshwater and marine sediments, as well as soils, serve as sinks for many anthropogenic compounds, including MP. Solid matrices are often heterogeneous and patchy in nature. The amount collected and the spatial design of the collection should reflect the overall objectives of the study. Details of sample collection in specific matrices are provided in the following sections.
3.4.2.1 Soil
Soil collection methods should reflect the overall objective of the project. For example, if the project goal is to determine ambient air deposition or stormwater resuspension/runoff potential, samples should be collected from the soil surface. However, deeper cores may be appropriate for insight into historical human activities or temporal changes in deposition. The location, historical property use, surface cover, biological activity, and general soil characteristics can all affect the distribution and abundance of MP, and these factors should be taken into consideration when contemplating the project design and relevant collection methods.
Soil environments are heterogeneous and discontinuous on a spatial scale; as such, it is very important to set up a sampling strategy that captures the variability within a specific sampling site across space and by depth. Different sampling strategies can be employed to obtain a representative sample at a given site, including random sampling, transect sampling, and incremental sampling methodology (ITRC 2020). Where resources are limited, several samples could be combined to form a composite sample to reduce the number of samples to be analyzed. Important considerations during sampling include ensuring that all samples are collected at the same depth, avoiding cross-contamination of samples during sampling, using appropriate cleaning procedures for sampling equipment, and using nonplastic sample collection and storage containers.
Soil samples can be collected by pushing a sample corer (for example, hand auger or direct push split spoon sampler) into the soil column or collecting a grab sample from the soil surface. Using a corer allows for the collection of a sample at a discrete or deeper depth interval. Vegetation should be removed from the sample matrix. If mass reduction or sample splitting in the field is necessary, refer to Section 4.6 of ITRC ISM-2 (ITRC 2020).
3.4.2.2 Sediment
Sediment collection methods should reflect the overall objective of the project. For example, if the focus is on the biologically active fraction of the site, collect approximately the top 5 cm of sediment. For insight into historical accumulation at a site, cores may be more appropriate. When collecting sediment in conjunction with or at the same location as surface water, sediment sample(s) should be collected after the collection of water sample(s) to avoid sediment disturbance and suspension into the water column. The depth, currents, organism activity, and general sediment characteristics can all affect the distribution and abundance of MP, and these factors should be taken into consideration when contemplating the study design and relevant collection methods.
Sediment samples can be collected by pushing a sample corer into the sediment column or collecting a grab sample (for example, using a bucket/scoop sampler). Using a corer allows for the collection of a sample at a discrete or deeper depth interval. A grab sampler can be used to collect surface sediment samples. The grab sampler should be deployed with as little disturbance to the sediment as possible. After retrieving the sampler, carefully empty it into a nonplastic tray to preserve the sediment layers. If mass reduction or sample splitting in the field is necessary, refer to Section 4.6 of ITRC ISM-2 (ITRC 2020).
Specific considerations for MP sediment collection (USEPA 2020) include minimizing exposure to fraying ropes or other plastic items that may be onboard collection vessels; this is critical to decrease MP contamination. If life jackets are in use, note their color, and avoid those with shedding straps or materials. If plastic debris is present on the boat (that is, shedding equipment or rope), take a small sample of plastic and retain it in aluminum foil for potential analysis. This will help reduce uncertainty in air-blank contamination.
If sediments are subsampled onboard, ensure that vessels and equipment used are plastic free and rinsed before use, and air blanks are used appropriately to capture any incidental contamination.
3.4.2.3 Pore Water
Traditionally, pore water samples can be collected through bulk/active sampling methods, such as direct push pore water samplers/probes, modified piezometers, or sediment grab samples. Sediment may also be collected using a stainless-steel sampler and centrifuged in a lab; however, this typically requires a large volume of sample matrix. Modified piezometers can often supply up to 1 liter of water per sample; however, these are made of PVC that may lead to sample contamination. Direct push pore water samplers/probes are generally both stainless-steel based. Direct push pore water samplers are easy to use but are limited to a smaller volume of water. A plastic syringe or peristaltic pump may be used to draw water from it, along with plastic-based tubing. If this method is used, include equipment blanks to account for any possible sample contamination by plastic particles shed from equipment.
3.4.2.4 Biosolids
Wastewater sludge and biosolids share many similar characteristics to soil and sediment and can be collected in many of the same ways as for these matrices. The most common method of collection for sludge and biosolids is to collect grab samples at a location where the samples will be representative of treatment. Sample volumes up to 250 g should be collected into glass or stainless-steel containers using a stainless-steel spoon or scoopula if necessary (Lares et al. 2018, Lusher et al. 2017). If possible, multiple samples should be collected throughout the day and composited together to create a more representative sample for analysis. Consider adapting the principles described in ITRC ISM-2 Section 4 (ITRC 2020). Similarly, consideration should be given toward collecting multiple composited samples throughout the week to assess and determine their variability (Lusher et al. 2017). Additional data should also be collected to characterize and account for the dry weight and organic content of samples.
3.4.3 Air
All airborne MP morphologies tend to follow the same distribution pattern: an increasing number of particles at lower size ranges (Brander et al. 2020). The low µm size of airborne MP particles makes sample collection challenging. Most limits of detection for visualizing particles with the naked eye are in the 50–200 µm range (Brander et al. 2020). Designing a sampling protocol with objectives and research questions in mind is an important planning step and will drive many sampling decisions. As of 2021, airborne MP sample collection procedures and pretreatment protocols are only in the early stages of development. There are two sampling scenarios for airborne MP:
- deposition on land and water from MP particles that settle out of air
- suspension in the air, which can allow MP, dependent upon particle size, to travel long distances (Brander et al. 2020)
MP that settle out of air are typically sampled using a passive collection method such as total atmospheric deposition (Zhang, Zhao, et al. 2020, Zhang, Kang, et al. 2020). Atmospheric deposition can be dry or wet. Passive deposition samplers use gravity to remove dry particles by sedimentation or wet particles by precipitation (Knobloch et al. 2021). Passive total or bulk deposition samplers are easy to use, support sample collection consistency through use of a standardized method, and do not need a power source (Liao et al. 2021). Knobloch et al. (2021) tested several low-cost passive sampling options for MP that settle out of air. The team found that an adhesive sampler (that is, a petri dish covered in double-sided adhesive tape) is not a useful method to collect airborne MP, an automatic wet deposition sampler is of limited use because low rainfall can prevent samples from being collected, and simple equipment consisting of a funnel over a collection bottle or an open beaker was reliable for collecting atmospheric fallout. For reporting purposes, the area of the moistened filter paper, petri dish, or funnel used to collect MP fallout should be recorded (Brander et al. 2020).
Deposition sampling does not accurately measure airborne MP that may be suspended in air and subject to inhalation. MP suspended in air may be measured using active pump samplers, which pass known volumes of air through a collection filter over various time periods at selected locations (Liao et al. 2021). Airborne MP can be collected using a total suspended particulate sampler equipped with glass microfiber filters. Mechanisms of particle capture for airborne filtration include impaction, interception, sedimentation, Brownian motion/diffusion, and electrostatic attraction. The filter pore size and diameter should be selected to capture the size range of MP targeted. The sampler can be placed on a stationary tripod adjusted to the average height (for example, 1.2 m) for human inhalation, worn for personal sampling, or placed on a rooftop for large-scale background sampling. After filtration, filters should be carefully removed and immediately transferred using metal forceps into a nonplastic, sealed sample collection container (Liao et al. 2021). A drawback to active pump samplers is that hundreds to thousands of liters of air are required to collect enough MP on a filter paper or in a mesh bag to analyze (Brander et al. 2020). For reporting purposes, the volume of air filtered and MP counts per volume (liter or cubic meter) of air filtered should be recorded. Counts can be made using in-line flow meters or totalizers (Brander et al. 2020). Velimirovic et al. (2021) listed a variety of other types of active samplers that are currently used to sample indoor dust, but may, with development, be used for MP: stationary cascade impactors, stationary cowled sampling heads, and personal cascade impactors.
Guidelines for estimating human exposure to MP through inhalation can be found in Wright et al. (2021).
3.4.4 Biota
The chemical composition, additives, and adsorbed pollutants associated with MP when ingested, inhaled, or contacted by biota may impair critical body functions and influence the functional role the organism fulfills in the food web and in the ecosystem. Biota from various habitats (aquatic and terrestrial) and various parts of organisms (such as tissue, gills, organs, digestive tract) can be used to monitor MP in the environment. Permits may be required for biota collection. There is currently no consensus for choice of species or monitoring strategy for biomonitoring (Brander et al. 2020). A baseline method/harmonized protocol was developed in 2018 for sampling and processing targeted biota (for example, bivalves, benthic macroinvertebrates, and fish) and for extracting and characterizing MP in biota samples (Bessa et al. 2019). The tissue or organ sampled should be dependent upon the DQO of the research. For example, if human exposure is a research objective, fillet or muscle tissue of fish should generally be sampled (unless the species is generally consumed whole—for example, anchovies). The following criteria were recommended for selecting appropriate species for MP monitoring (Bessa et al. 2019):
- species that occur naturally with high abundance and wide geographic distribution
- species that are easy to sample and process in the laboratory
- species that are already used as bioindicators for biomonitoring in other studies
- species with ecological and socioeconomic relevance
- species that cover several ecological/functional roles, niches, or feeding guilds
In addition to the above criteria, particulate feeding habits of organisms must be considered. Filter feeders that selectively discriminate against particles with specific size, surface area, or morphology (that is, fragment vs. fiber) should not be used (Ward et al. 2019). Marine, aquatic, and terrestrial biota can be sampled by various methods—for example, trawl nets (for example, Manta, plankton, seine), kick or D-frame nets, cages, traps, or manual collection by hand. For small species, Bessa et al. (2019) indicated that a sample size of at least 50 specimens of similar size per research unit (species, food web, feeding type, etc.) be collected to represent the population. When smaller sample sizes are used due to resource constraints or as indicated by statistical power analysis, justification should be documented (Bessa et al. 2019). In all cases, efforts should be made to reduce the number of organisms collected and to use humane methods of capture and handling to minimize the impact on biota and their environment.
Additional methods for various specific biota types, such as plant matter (Oliveri Conti et al. 2020) and biofilm (Glaser 2020, Parrish and Fahrenfeld 2019), have been proposed and are included in the Sampling Tool.
MP loss may occur between sampling collection and preservation. Gut evacuation times vary between organisms and loss of MP may occur via egestion; therefore, it is important to minimize the time it takes to preserve samples (Lusher et al. 2020). Stress due to handling may also result in the organism regurgitating, which can bias MP counts if the gut is being analyzed (Lusher et al. 2020).
Traditional preservatives such as formaldehyde and ethanol can degrade certain polymers; therefore, it may be beneficial to consider desiccation or freezing to preserve samples (Lusher et al. 2020)
3.5 Sample Preservation
Plastics are generally recalcitrant and not prone to rapid degradation, hence our problem in the environment (Gerritse et al. 2020). Plastics that are dry (for example, on slides or filters) can be stored at room temperature out of direct sunlight. Long-term storage of plastics in aqueous or wet matrices (for example, sediment, water) should occur at 4ºC in the dark to prevent or slow bacterial degradation and ensure UV degradation does not occur. A preservative may be added dependent upon the DQO, and if it does not interfere with future analysis. However, for short periods of time, such as in transit from field to laboratory, or in between laboratories, room temperature storage is adequate. Multiple freeze and thaw cycles are not recommended as plastic particles may crack and further degrade. However, for storage of samples that easily degrade, such as biota or biosolids, one freeze and thaw cycle that is consistent with sample storage may not damage particles. For long-term storage of bulk samples, it may be advisable to reduce or remove the organic liquid fraction of the sample through sieving, rinsing, and cleanup procedures (for example, digestion) prior to storage to prevent sample degradation or fouling (Hidalgo-Ruz et al. 2012).
3.6 Sample Preparation
Most environmental samples will have some degree of organic matter and suspended solids content that will require removal or purification before MP can be extracted before identification and quantification. Sample preparation is a necessary step to minimize false positives and increase efficiency and effectiveness of sample characterization. Extraction methods for Fourier transform infrared spectroscopy (FTIR), Raman, laser direct infrared spectroscopy (LDIR), and to some extent, pyrolysis–gas chromatography–mass spectrometry (GC/MS) all have similar preparation steps before identification. These steps usually involve removal, concentration, and cleanup from the environmental matrix. The steps required and the degree of organic removal is matrix-specific; see specific matrices below for more details.
3.6.1 Water Samples
There are many variations in existing methods for the processing of aqueous samples (reviewed by Andrady 2011, Hidalgo-Ruz et al. 2012, Koelmans et al. 2019, Prata, da Costa, et al. 2019, Wang and Wang 2018b). Processing of all water samples typically follows the same or similar processing steps. Generally, during or after water samples are collected, they are often poured through metal sieves to reduce the sample volume for processing, and to classify particles by general size bins of interest. Materials captured on the sieves can be transferred back into containers for removal of organic matter through digestion or oxidation procedures, poured through filters for quantification and analysis, or transferred into dishes for wet sorting, quantification, and analysis. Samples may also be directly filtered for those with cleaner matrices or if size fractionation is not required. The degree of sample processing and oxidation required to treat water samples will depend on the amount of organic matter present, suspended solids, and interferences such as algae or debris.
In 2020, ASTM released the first standard practice for the collection and preparation of water samples with low to high suspended solids for identification and quantification of MP particles and fibers using Raman spectroscopy, IR spectroscopy, or pyrolysis-GC/MS (ASTM D8333-20, ASTM 2020b). This method has been validated for drinking water, surface waters, wastewater influent and effluent, and marine waters and is recommended for the processing of these samples. Briefly, organic matter is removed through a wet peroxide oxidation followed by enzymatic digestion to remove remaining cellulose, lipids, and chitin. Cleaner samples such as drinking water or tertiary treated effluent may not require oxidation or digestion steps
3.6.1.1 Drinking Water and Groundwater
Public drinking water and bottled water present a less complex matrix than other types of media due to treatment and filtration processes used to make the water safe for drinking (Smith et al. 2019). Most of the time, studies have used direct filtration of samples through filters or sieves to recover MP from raw or treated water, bottled, or tap water. When selecting size of filter and volume to be filtered, it is important to consider the type of sample to be filtered—that is, tap water, bottled water, or raw water—as that might influence the overall particle size ranges/distribution. If necessary, subsampling or filtration of samples through filters of different sizes could be incorporated to avoid clogging of filters and to reduce number of particles. For samples containing a large amount of background interference, prefiltration steps including cation exchange columns can be incorporated as necessary to remove calcium and magnesium cations and iron precipitates and to dissolve organic matter.
Specific considerations during direct filtration of samples include:
- Samples should be well mixed by gentle agitation prior to filtration.
- Any devices used for filtration should be well rinsed to remove any particles around the filtration surfaces.
- Laboratory blanks should be incorporated to determine the potential contamination of samples by external particles during sample analysis.
Recently, the California State Water Board adopted Raman (>20 µm in size) and FTIR methods (>50 µm in size) for MP identification in drinking water samples (CA SWRCB 2021b, a).
3.6.1.2 Surface Water and Porewater
Surface waters and porewaters will include many of the same processing steps as for drinking water and groundwater; however, more intense organic matter digestion or oxidation may be required. This could include a more aggressive digestion procedure, or additional and/or longer oxidation steps.
3.6.1.3 Wastewater and Stormwater
Procedures for the preparation and separation of MP from wastewater and stormwater samples will have many similarities to those used for surface waters. The degree of sample purification or processing required will depend on the amount of organic matter and suspended solids present in the sample, which can be inferred by measuring a sample’s total dissolved solids (TDS) or conductivity. For example, raw sewage, influent, and first flush stormwater will likely require more sample processing than treated effluents, and a test processing step may be helpful to determine what level of oxidation is required. Generally, wastewater and stormwater samples will require an extensive organic matter digestion/oxidation step following sieving through mesh sieves to reduce sample volume. Materials collected on sieves can be rinsed back into a beaker or flask and subjected to oxidation using ASTM D8333-20 (ASTM 2020b) or other digestion procedures using hydrogen peroxide, Fenton’s reagent, enzymes, or acidic or basic digestions (Habib, Thiemann, and Al Kendi 2020, Sun et al. 2019, Wang and Wang 2018b). As with all analyses, additional processing steps can result in loss of analytes, and positive spiked blanks should be used to determine percent recoveries.
3.6.2 Solid Samples
Solid matrices such as sediments, soils, and biosolids present a unique challenge to MP extraction. The complex organic carbon matrix of these samples can confound identification of MP (which are also carbon based). In addition, the mineralogy of these samples often has a similar density to MP and is extracted along with MP in density separations. Many methods exist to extract MP from these matrices (Adomat and Grischek 2021, Besley et al. 2017, Cadiou et al. 2020, Cashman et al. 2020, Claessens et al. 2013, Coppock et al. 2017, Crichton et al. 2017, Fu et al. 2020, Herrera et al. 2018, Hung et al. 2021, Karlsson et al. 2017, Masura et al. 2015, Miller et al. 2021, Nguyen et al. 2019, Nuelle et al. 2014, Piehl et al. 2018, Prata, da Costa, et al. 2019).
Methods to extract MP from solid matrices generally include size separation (for example, sieves), a density separation, and then an oxidation step (Hidalgo-Ruz et al. 2012, Van Cauwenberghe et al. 2015). Density separation takes advantage of the lower density of many plastic polymers and involves mixing and incubating a sample with a high-density salt such as NaCl, NaI, ZnCl, etc. Floating or neutrally buoyant particles are retained for analysis, while heavier particles that often include mineral and inorganic content are discarded. For denser MP such as TWP or PVC, a denser salt solution should be used to ensure that these particles are removed (Klöckner et al. 2019). The same or similar oxidation or digestion procedures as used for water matrices can then be applied to sediment matrices before or after density separation (Hurley et al. 2018). The particles are often collected on a filter or membrane for further identification via a spectroscopic or other means of chemical identification. Practices to avoid are (Cashman et al. 2022):
- drying sediment—drying is a reasonable practice for sand, but not sediment, as dried sediment can become a solid hard mass that is difficult to sieve or to further process
- pouring liquids that include MP from the tops of beakers—particles cling to the glass beaker and are difficult to remove)
- excessive transfers—particles are lost during transfers
Additional glassware rinsing using the density separation salt or deionized water (DI) during processing may also increase recovery by containing MP that may float and stick to glassware (De Frond et al. 2022). The Southern California Coastal Water Research Project (SCCWRP) performed a round-robin using a series of methods for sediments and other matrices (De Frond et al. 2022).
Regardless of the method chosen, it is important to use a spiked control so one can quantify the percentage recovery of appropriately sized MP.
3.6.3 Air Samples
Air samples contain natural particles that need to be removed using a digestion treatment to improve the detection and identification of MP in the sample. Airborne particles on the filters should be washed into a glass beaker containing an oxidizing agent (for example, hydrogen peroxide, 30%) then heated (for example, to 70ºC for 1 hour) to remove natural organic matter (Liao et al. 2021). Other digestion methods may also be used (for example, wet acid treatment, alkaline digestion, or enzymatic digestion). After digestion, the remaining particles can be filtered and stained (for example, using Nile Red) prior to analysis. Preconcentration techniques (for example, filtration, density separation, centrifugation) of sample extracts should also be considered to allow sufficient concentration of low µm-range MP before further analysis (Velimirovic et al. 2021).
3.6.4 Biota Samples
Organisms should be measured and weighed in the laboratory prior to extracting target tissues (Bessa et al. 2019). Extraction of tissues will depend on the project DQOs; for example, the full gastrointestinal tract of fish or the entire body of small invertebrates (for example, bivalves, benthic macroinvertebrates) can be extracted and stored in covered glass containers (Bessa et al. 2019).
When digesting biota samples, avoid using chemicals that can cause damage to plastic polymers’ composition or morphology (Bessa et al. 2019) if physical characteristics of MP are important. A variety of digestion approaches exists. Hydrogen peroxide (15%), potassium hydroxide (10%), and enzymatic digestion are nondestructive; alkaline digestion, acid digestion, and hydrogen peroxide (30%) may be destructive. Each approach has advantages and disadvantages, and approaches may be combined to achieve project goals.
Increased efficiency of the sorting and characterization steps can be obtained by removing dense inorganic particles by digestion followed by density separation. A variety of solutions can be used to perform density separation. Denser solutions are more appropriate for projects targeting PVC, PET, and other dense polymers (Bessa et al. 2019).
Dissection, depuration, homogenization, and digestion of tissues with chemicals or enzymes are methods that can be used to extract MP from biota (Lusher et al. 2017). Dissection of the gastrointestinal tract is the primary method for assessing MP content in larger animals. If accumulation is the primary focus, then depuration should be used to remove transient MP particles in the intestinal tract. Depuration ensures only MP retained within tissues or entrapped in the intestinal tract are considered. While depurating, exposure water should be refreshed frequently to avoid consumption of the egested particles (Lusher et al. 2017).
Biological material, biofilms, and algae can make it more challenging to identify MP particles. Therefore, digestion can be used to isolate MP particles extracted from tissues or environmental samples. Traditional digestion chemicals can damage or degrade certain polymers. Lusher et al. (2020) provided chemical resistance data related to MP analysis in tissues.
Edible tissues can be analyzed for human health considerations, and MP present in dissected tissues can be isolated using saline washes, density flotation, visual inspection, or digestion (Lusher et al. 2020)
3.7 Analysis and Identification
3.7.1 General Considerations
Screening methods such as Nile Red staining exist (Erni-Cassola et al. 2017) and may be a useful first step under some circumstances, but positive chemical identification of particles is critical to accurate quantification of plastics in environmental samples. Plastics can mimic naturally occurring materials and vice versa. Interlaboratory studies have demonstrated that excellent recovery and chemical identification for particles greater than 50 μm in size is possible (De Frond et al. 2022). Instrumentation allows us to identify specific polymers of plastic that may allow for source tracking and possible remediation. Instrumentation and methods are rapidly advancing as manufacturers recognize the need for plastic polymer identification. Identification of MP can be either destructive or nondestructive. Nondestructive methods (for example, FTIR or Raman) allow physical characteristics (that is, size, shape, and color) of MP to be characterized. Destructive methods (for example, thermal degradation methods such as pyrolysis-GC/MS) are potentially faster and provide polymer mass (weight), but the process destroys the physical characteristics of the MP particles. Pre-sorting MP particles into size classes may offset this disadvantage (Bessa et al. 2019).
Analytical methods are summarized in Table 3-1.
3.7.2 Detection Approaches
MP can be detected using several different methods:
- visual methods. Visual examination of a sample with or without magnification.
- spectroscopic methods. Capture and assign the characteristics of specific chemical structure of polymers using reference spectra.
- thermoanalytical/chemical methods. Pyrolyze the sample under inert conditions and specific decomposition products of the individual polymers are detected.
NP methods are under development. It is likely that multiple analytical methods used in combination will be needed to detect and quantify these very small particles (Enyoh et al. 2021). For particles down to 600 nm, an emerging technique, optical-photothermal infrared (O-PTIR) microspectroscopy that can provide 3D images of cells and organisms, may be useful (Su et al. 2022). Other promising techniques include laser diffraction spectroscopy, field emission scanning electron microscopy with energy dispersive x-ray, tip enhanced Raman spectroscopy, and infrared nanospectroscopy (Enyoh et al. 2021).
Table 3-1. Summary of microplastic characterization techniques
| Description | Analysis Time/ Sample | Size Detection Limit | Measurement Preparation | Identifies Polymer Types | Detects Additives /Surface Chemicals | Detects Particles or Mass |
| Visual Methods | ||||||
| NE Naked eye |
Hours | 1 mm | None | No | No | Particle |
| SM Stereo microscopy |
Hours | 100 µm | On filter | No | No | Particles |
| FM Fluorescence microscopy |
Hours | 50 µm
(Possibly smaller based on objective lens used) |
On filter | No | No | Particles |
| SEM Scanning electron microscopy |
Hours | 0.001 µm | On filter | Yes | No | Particles |
| Spectroscopic Methods | ||||||
| FPA-FTIR Focal plane array-Fourier transform infrared spectroscopy (in transmission mode) |
Hours | 20 µm | On special filter | Yes | No | Particles |
| FTIR Fourier transform infrared spectroscopy (in transmission mode) |
Days | 20 µm | On special filter | Yes | No | Particles |
| LIDR Laser direct infrared spectroscopy |
Minutes particles/ hour | 20 µm | Special microscope slide | Yes | No | Particles |
| NIR, vizNIR Near infrared spectroscopy, visible-near infrared spectroscopy |
Hours | Unspecified | On filter | Yes | Surface Chemicals only | Particles |
| Raman Spectroscopy |
Days | 1 µm
(Theoretically but challenging to achieve) |
Extraction and placed on filter | All polymers | Yes | Particles |
| Thermoanalytical/Chemical Methods | ||||||
| DSC+TGA Differential scanning calorimetry+ Thermal gravimetric analysis |
Hours | Unspecified | Filtrate | Yes, only PE, PP | No | Mass |
| Py-GC/MS Pyrolysis–gas chromatography–mass spectrometry |
Hours | <1–0.5 µg | Isolated particles | Yes | Yes | Mass |
3.7.3 Identification Methods
3.7.3.1 Microscopy
Microscopy can be used as a tool when separating particles for further identification with a spectroscopic method (discussed above). It has limited use for positive identification as many particles (natural and anthropogenic) have similar appearances. For larger particles (>500 µm) hot needle (De Witte et al. 2014) method microscopy may be useful as a screening method, particularly for education and outreach programs.
3.7.3.2 Fourier Transform Infrared Spectroscopy (FTIR)
Fourier transform infrared (FTIR) spectroscopy uses broad frequency infrared light to illuminate samples. The spectrum of absorbed frequencies provides structural information regarding the types of organic compounds that compose the MP particles. FTIR can be operated in reflection, transmission, or attenuated total reflectance mode. A micro-FTIR using attenuated total reflectance mode can analyze particles as small as 20 microns in size. Many different plastics and natural materials can be identified, including PET, PVC, polytetrafluoroethylene (PTFE), polyurethane (PUR), PA, polystyrene (PS), PP, and PE (Figure 3-5).
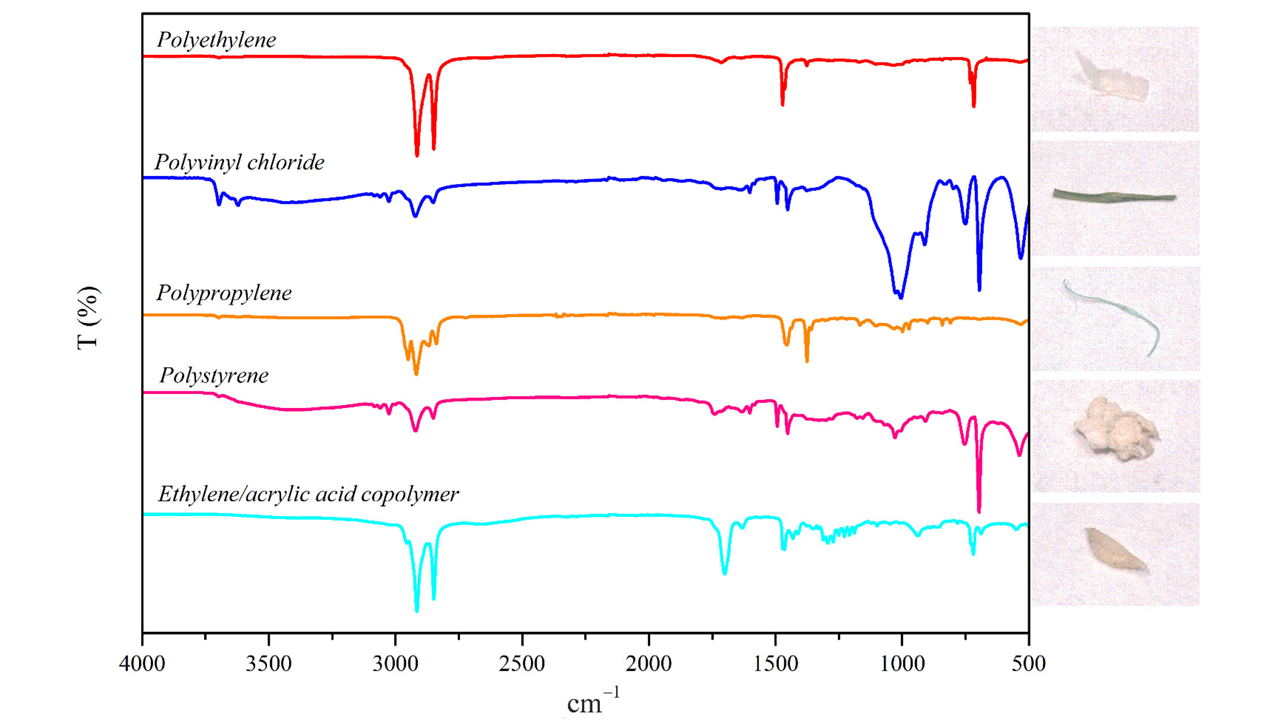
Figure 3-5. Polymers identified in selected MP samples identified by micro-FTIR.
Source: Li, Wang, et al. (2021)
Prior to FTIR analysis, MP are generally extracted or concentrated. For drinking water, a clear water sample (for example, bottled or potable water) (0.5–2 liters) is filtered through a silicon wafer (1 µm porosity). Particles in the 32–350 µm range are counted.
Spectrophotometric methods such as FTIR or Raman microspectroscopy (µRaman) have inherent size limitations due to wavelength of the light source and interference from other particles (see Section 3.7.3.5 for additional information on Raman microspectroscopy). The lowest size limit for detection is 10 µm for FTIR and 0.5 µm for Raman (Velimirovic et al. 2021).
Recently, the California State Water Board adopted an FTIR method for MP identification in drinking water samples (CA SWRCB 2021a).
Key Advantages (in General)
- most effective for particles >50 µm
- nondestructive
- can be used on fluorescent samples
Current General Technique Limitations
- less effective for translucent polymers
- less effective for particles <50 µm
3.7.3.3 Pyrolysis and Thermal Extraction and Desorption GC/MS (TD/GC/MS)
Pyrolysis and GC/MS. A pyrolizer coupled with a GC/MS is used for polymer analysis. Particles are introduced into the pyrolyzer and thermally degraded into various compounds in an inert atmosphere. When polymers are pyrolyzed the resulting gas contains compounds unique to the polymer in question. By introducing this gas into a GC/MS, the identity of these compounds can be related to various polymers. Thus, individual polymers can be identified in a range of sample matrices.
The methods used during sample preparation vary greatly with different samples, but after sample prep the sample is contained on a filter of a predetermined pore size, according to the sample composition and analytical goals. An inert filter with collected material is dried in a desiccator and placed in a sample cup. The sample cup is pyrolyzed at different temperatures in a helium atmosphere. Individual polymers produce unique compounds that are identified based on mass spectra and retention times. Quantification is based on calibration curves for each polymer.
This method is suited for qualitative and quantitative determination of the following polymers: PE, PP, PVC, PC, PS, PET, polymethyl methacrylate (PMMA), and PA. The method also includes determination of common rubber components polybutadiene and polyisoprene.
Thermal Desorption and GC/MS. Like pyrolysis, the thermal desorption method (TD/GC/MS) is based on obtaining decomposition or cracking products which are created when a polymer undergoes breakdown in an inert atmosphere, due to the action of heat. The effects of this action can be very different depending on the composition and chemical structure of the polymer (La Mantia et al. 2017). In general, high thermal exposure results in the formation of volatile products, the nature of which is dictated by the chemical and physical properties of both the polymer and the decomposition products (Beyler and Hirschler 2002). In TD/GC/MS, the degradation is controlled to obtain the most volatile fraction of the sample, without exceeding 380ºC. The samples are filtered onto a conditioned quartz filter and introduced into the TD system. The compounds obtained from their degradation are concentrated in a cold trap at -15ºC and subsequently introduced into the GC/MS system by ballistic heating. Similarly, the calibration curve is made with the degradation ions characteristic of each polymer. USEPA Method 8275A could be extended to include the decomposition products of MP (USEPA 1996).
The preparation of the samples depends on the characteristics of each matrix, and once the sample has been treated, it is easy to introduce it into the TD tube for analysis by TD/GC/MS.
Key Advantages
- more easily applied to small particles than spectroscopic techniques up to 0.3 µm
- shorter sample preparation time
- reports polymer mass detected by degradation products
- can report polymer additives
- high level of automated instrumental analysis
- easier interpretation of raw data chromatograms
Current Technique Limitations
- does not report number of particles, size, or shape
- degradation products not always unique for each polymer
- larger particles may overwhelm signal from smaller particles
3.7.3.4 Laser Direct Infrared Microscopy (LDIR)
The laser direct infrared (LDIR) imaging system is an infrared (IR) spectrometer using a quantum cascade laser (QCL) as a light source that is coupled to a rapidly scanning imaging system (Scircle et al. 2020). The instrument was originally designed for the pharmaceutical analysis of tablets, laminates, tissues, and fibers, but can also be used to analyze MP. The imaging system provides information on particle enumeration, size, and morphology, while the polymer type can be identified by the spectrometer.
For an IR analysis, the imaging system scans the sample on an IR reflective slide to identify, measure, and quantify the particles between 20 and 500 µm. There is an option of using the integrated high-resolution camera to take individual pictures of the particles and save them as PNG files. Each particle is then scanned and an IR spectrum in the fingerprint region (975–1800/cm) is generated (Scircle et al. 2020). This is then matched to a library and a hit quality is calculated. The workflow is fully automated by the acquisition software, and the size of the scanned area can be customized but is limited to size of the slide.
For particles greater than 500 µm, the instrument is equipped with an ATR (attenuated total reflectance) module. This is a germanium crystal that can be lowered onto a particle and a full spectrum can be obtained. This can then also be compared to a library to obtain a hit quality.
The instrument software comes with a published library (Primpke et al. 2018) for all the most common polymer and nonpolymer spectra. However, it can also be customized by generating a spectrum and manually adding it to the library
Key parameters including width (µm), diameter (µm), area (cm2), eccentricity, circularity, solidity, identification, and quality of match are reported for every particle.
Key Advantages
- The main element that gives the LDIR an advantage over other IR spectrometers (for example, FTIR) is the QCL, which is fast tunable and generates a spectrum in the fingerprint region faster than the conventional spectrometers.
- The software includes magnification and sizing tools and the ability to analyze a single particle and to define a line profile. The line profile is very useful when trying to analyze fibers. Once the length of the fiber is selected, the software will take as many spectra as the user defines along the fiber and combine all the spectra to create one spectrum, which can be run against the library.
Current Technique Limitations
- It is not possible to do in situ filter analysis with the instrument.
Application
LDIR has been applied to MP in matrices such as water (potable/environmental/waste), biosolids, sediment, soils, biota (for example, oysters and other mollusks) and food products (for example, salt, rice) routinely but also other specific client requests. The instrument works well for these purposes. However, as the analysis time is proportional to the number of particles detected (250 particles/h), a good sample cleanup is imperative. The eight most common polymers detected in the environment (PE, PP, PS, PVC, PET, PC, PMMA, and PA (Mammo et al. 2020) are reported. For quality control purposes, blank samples and laboratory control samples with PE certified reference material beads in two sizes (75–90 µm and 250–300 µm) and PS (30 µm) are prepared and run to quantitate the loss during sample preparation.
Figure 3-6. Sir Chandrasekhara Venkata Raman.
Source: Nobel Foundation
3.7.3.5 Raman
Raman is a spectroscopic method that relies on inelastic scattering of molecules to create a unique spectrum of molecules (an effect discovered by Sir Chandrasekhara Venkata Raman, who earned a Nobel prize in 1930 for this work, Figure 3-6). It is a nondestructive method capable of identifying MP particles from 5 mm to 1 µm. Newer Raman instruments can scan filters in a semi-automatic mode. Methods for general Raman operation exist (ASTM D8333-20, ASTM 2020b), but details to operate Raman instrumentation are typically manufacturer-specific.
Recently, the California State Water Control Board adopted Raman methods for MP identification in drinking water samples (CA SWRCB 2021b). The lowest particle size reliably detected by this method is 20 µm (CA SWRCB 2021b); however in theory, Raman can detect particles to 1 µm.
Key Advantages
- effective for particles <10 µm
- effective for translucent polymers
- not hindered by water, thus it can be used in sample preparation
- can perform analysis directly on filter media
- can distinguish the types of bonds between carbon atoms in the polymer aiding identification
Current Technique Limitations
- less effective for fluorescent samples
- less effective for completely black particles
- laser may destroy a particle before a spectrum is obtained
3.7.3.6 Spectral Libraries
Several spectral libraries for Raman and FTIR exist. In addition to those that can be purchased or are part of an instrument package, open-source spectral libraries for Raman and FTIR include Open Specy (Cowger et al. 2021), SloPP and SloPP-E (Rochman Lab 2022), and Systematic Identification of MicroPlastics in the Environment (siMPle) (Primpke et al. 2020). In addition, each instrument is slightly different, so it is recommended that researchers develop individual libraries consistent with their instruments.

